What's Probability Mean? A Taxicab Forecasting Case
What’s the meaning of probability? There are two primary views. The “frequentist” view defines probability as event frequency over repeated trials – if a coin lands heads in 50 out of 100 flips, there’s 50% probability of heads. On the other hand, the Bayesian view defines probability as “strength of belief” in possible outcomes of one trial – how a single geopolitical event unfolds, for example.
From the two views of probability follow two statistical philosophies. Each philosophy involves (1) observed data and (2) hypotheses about the process which generates those data. The “frequentist” philosophy estimates probability of data after assuming a hypothesis–the hypothesis itself has no probability, as it lacks a repeated trial nature. The Bayesian philosophy estimates probability of both data and hypothesis.1.
We can see these two philosophies’ first principles with an example problem: how many taxicabs are in an unfamiliar city?
For more about the calculations that follow, check out my R code.
Problem Statement
“Suppose you arrive in a new city and see a taxi numbered 100. How many taxis are there in this city?”2 Taxis are numbered 0, 1, 2, 3, …, up to the last taxi.
A Classical Approach
We already have intuition about how to proceed. The likelihood of the observed data – taxicab #100 – depends on how many taxis there are in total. Our estimate of total taxi count should somehow elevate the likelihood of what we observed.
A classical approach: estimate a total taxi count which maximizes the likelihood of the observed data.3 Under this approach, we estimate 101 total taxis. (Numbering started at zero.) Why? When the city has 101 taxis, the likelihood of observing taxicab #100 equals 1/101. This probability decreases from its maximum if the taxi estimate rises above 101.
Classical (Frequentist) Solution May Be Too Narrow
The classical approach may be too narrow to address our true problem. Suppose we want to quantify uncertainty in our total taxi estimate (hypothesis), given the data we observe. The classical approach does not directly accommodate that calculation. The limitation traces back to the classical approach’s fundamental definition of uncertainty/probability: event frequency over repeated trials. Hence the methodology name, “frequentism”.
Classical estimation uncertainty quantifies probability of data–which we could repeatedly sample, in theory–given a hypothesis about the world. An analyst might say: “if this idea about the world were true, then I’m unlikely to observe these data or some still more extreme.”
Frequentists do not quantify probability of a hypothesis–a single event–given data. For this calculation, we must take a different approach.
A Bayesian Approach
Suppose that we fundamentally define probability as, “strength of belief” in possible outcomes for an event. Now we can quantify the probability of a hypothesis, given data. The procedure follows directly from a fundamental statistical statement, Bayes’ Theorem:
- Quantify prior belief over hypotheses in a complete set
- Update beliefs: up-weighting hypotheses which make observed data more likely, down-weighting hypotheses which make observed data less likely
We see this approach in action with the taxicab problem.
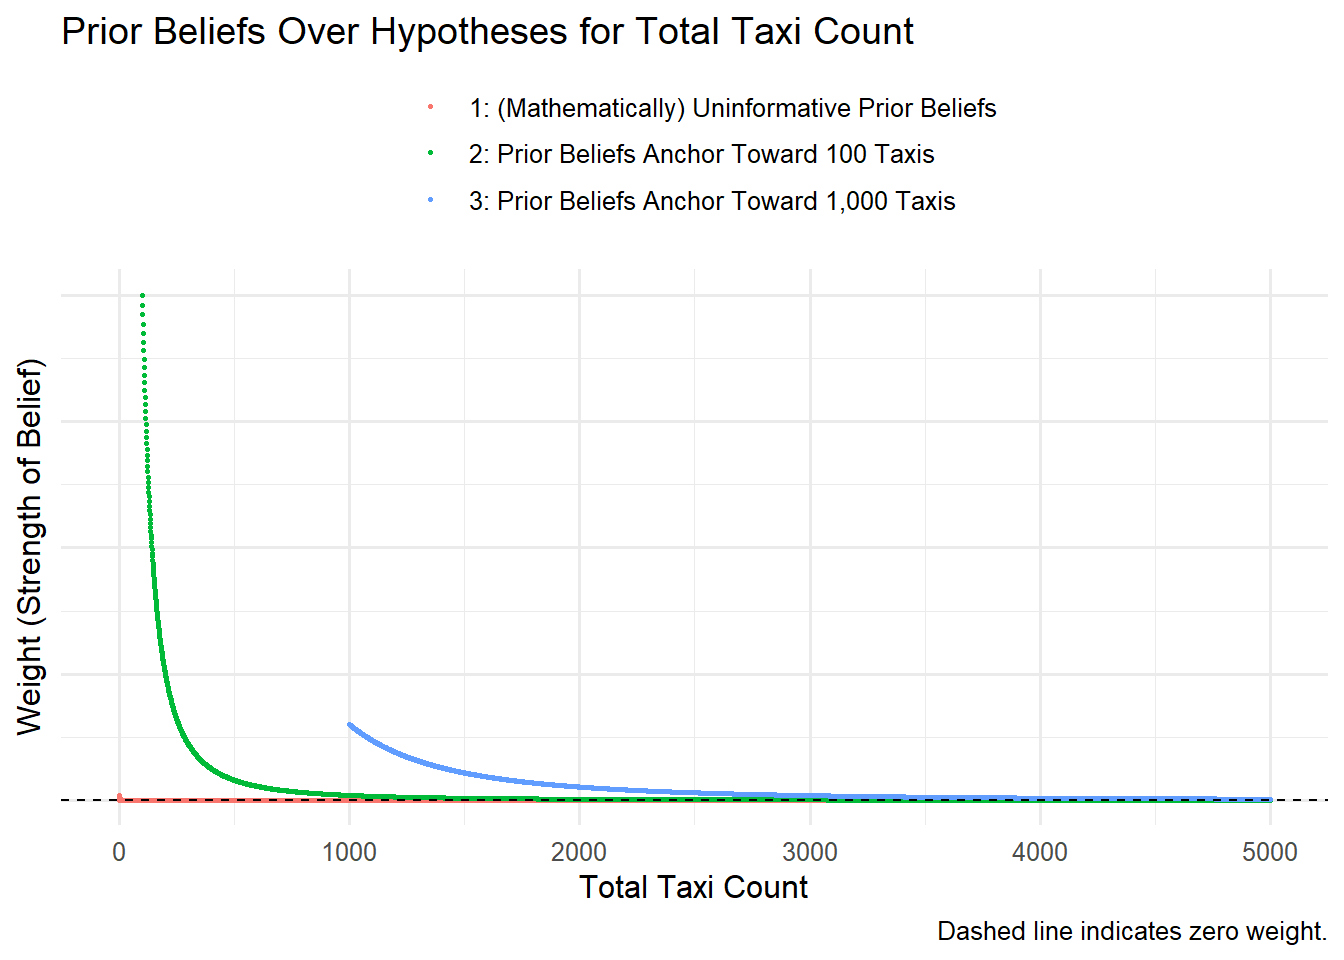
Quantify Prior Beliefs Over Hypotheses for Total Taxi Count
First we assign a “strength of belief” weight to each hypothesis for total taxi count. For problem-solving convenience, we can generate weights from the formula of a well-defined probability distribution.4
Because our prior beliefs influence our answer, it’s good practice to examine multiple scenarios of prior belief:
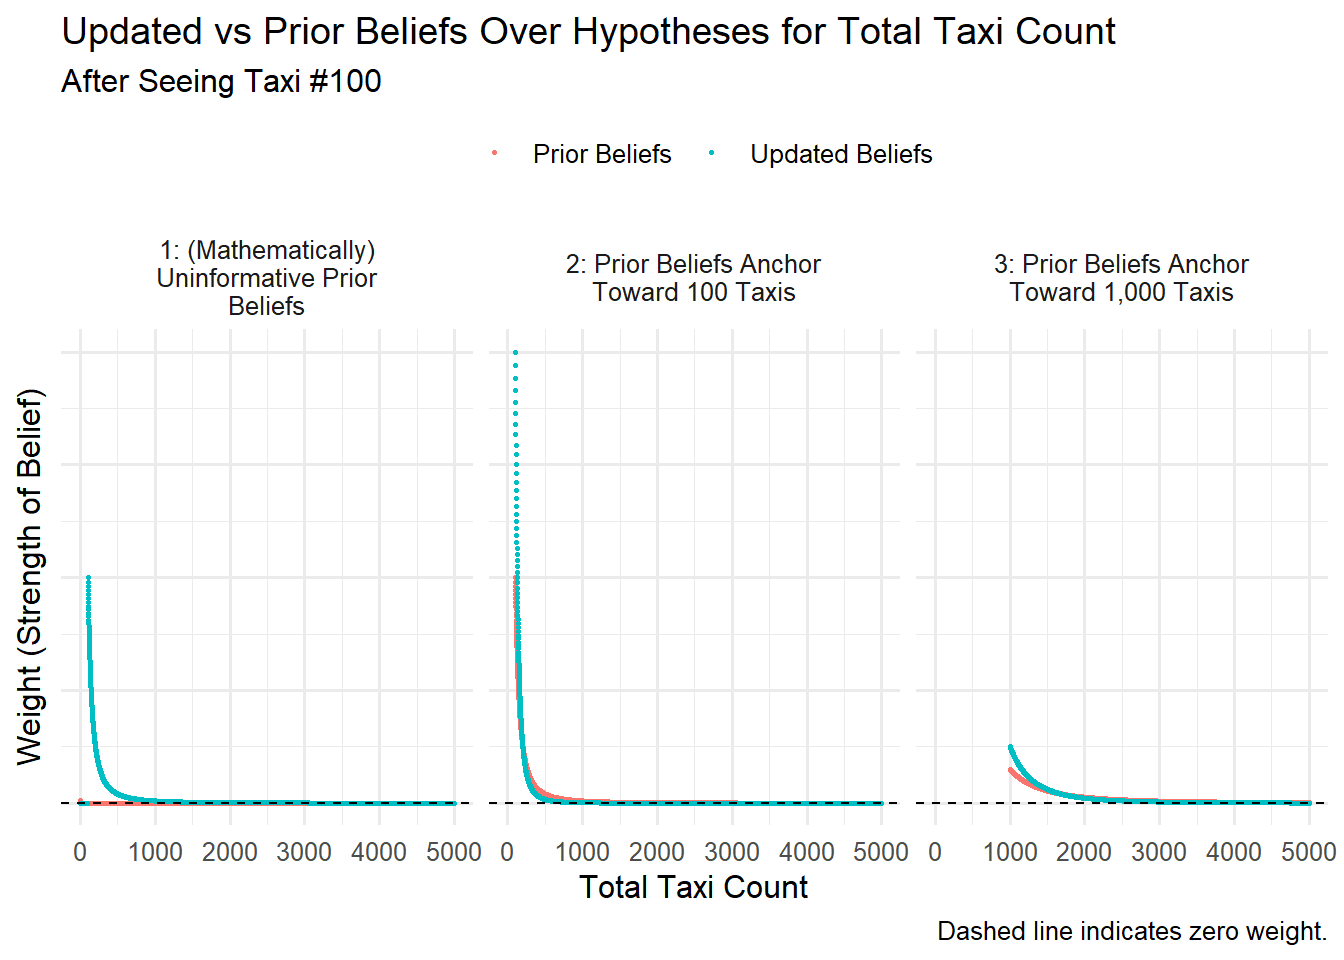
Update Beliefs About Total Taxi Count
Given the Taxi #100 evidence and our prior beliefs expression – the belief update is formulaic, and mathematically prescribed.
In each prior beliefs scenario, we increase our strength of belief in hypotheses around 101 total taxis. Because, when there are around 101 total taxis, the sighting of Taxi #100 is relatively more likely.
As expected, our hypotheses still reflect sizable uncertainty. We’ve observed only one taxi, and the next sighting could suggest a very different total count. So we maintain positive weight on many hypotheses.
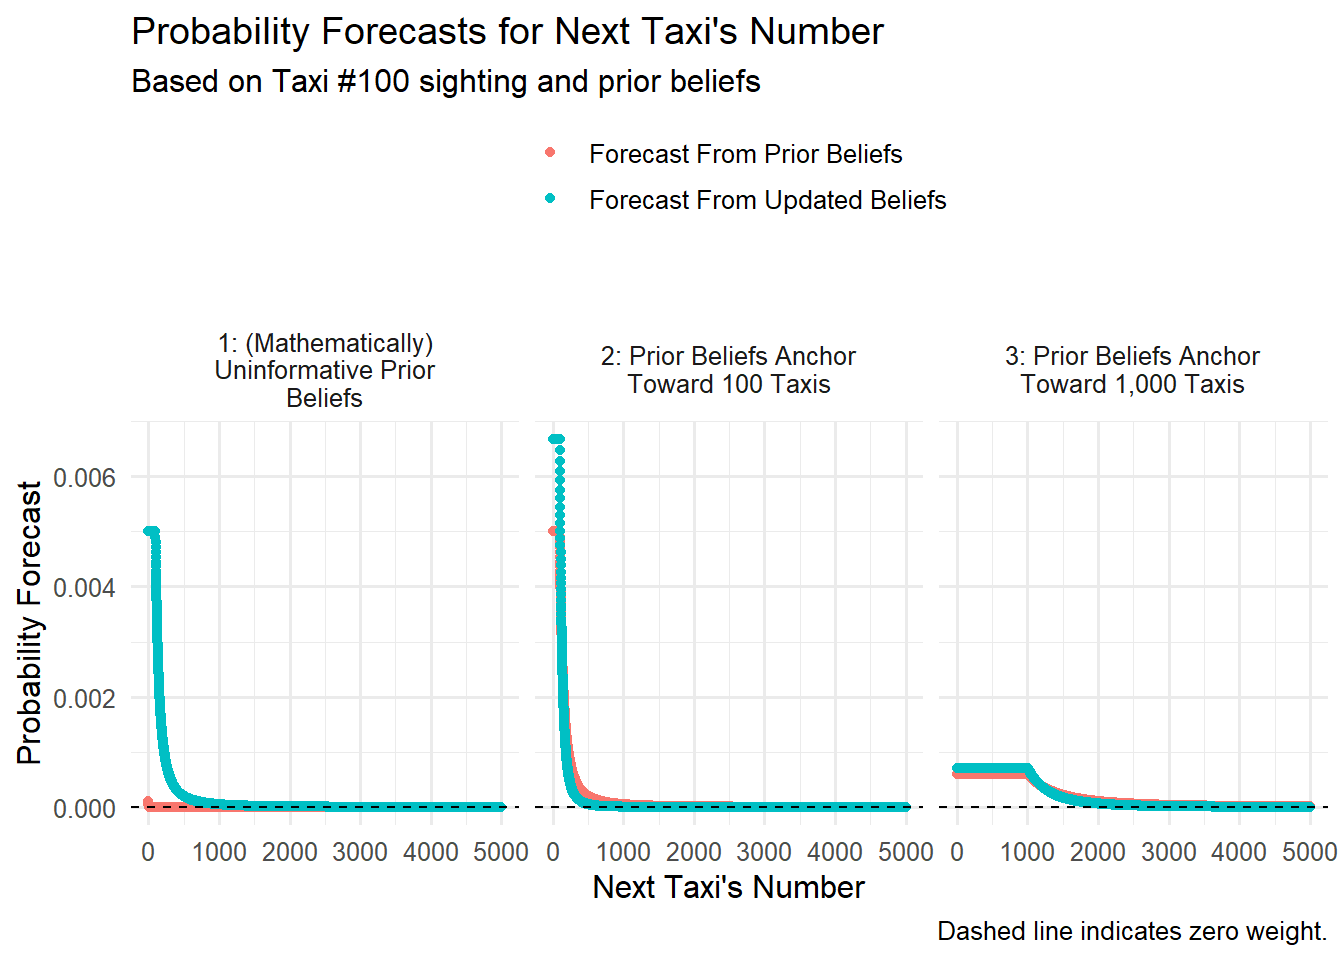
Forecasting the Next Taxi
We can forecast the next taxi sighting, using either set of beliefs about total taxi count (updated and prior). We’ll essentially average over our beliefs set.
Probability forecasts rise for next-taxi numbers made most likely under high-weight beliefs about total taxi count.
For more on how the philosophies assign probability to data and hypotheses, a helpful resource: https://ocw.mit.edu/courses/18-05-introduction-to-probability-and-statistics-spring-2014/76926c6068c8b18e6ecb48d649b15bfd_MIT18_05S14_Reading20.pdf.↩︎
I find this question in Kevin Murphy’s Machine Learning: A Probabilistic Perspective. A great read!↩︎
“Maximum Likelihood Estimation” is a fundamental method in statistics.↩︎
In particular, the Pareto distribution.↩︎