Predicting Lemons at Wholesale Auto Auction (2) - Predictive Model Introduction
Picture this. Your mission is to secure great deals on vehicles sold at wholesale auto auction. An intriguing prospect comes on your radar. How do you make the purchasing decision? How do you quickly weigh 25 pieces of available information? I’m eager to help. I introduce and verify a machine learning model trained by 70,000 historical transactions.
For context about this prediction problem and associated Kaggle competition, please see my overview post.
Key Takeaways
The used car market has heated up under COVID-19 restrictions. The market surge galvanizes wholesale auto auctions, where vehicle purchasing decisions were already uncertain and demanding.
Auction purchasing decisions may be further supported with a machine learning model. My model uses an auctioned vehicle’s characteristics to predict “lemon probability,” after learning from 70,000 historical transactions.
My model prototype delivers strong performance. It ranks 90th percentile when scored by Kaggle’s archived prediction competition.
Problem Materiality Appears Elevated by COVID-19
The used car market has heated up under COVID-19 restrictions. For one, new car supply has been hampered: Spring 2020 shutdowns froze production lines, and pressures continue under early 2021 semiconductor shortages (WSJ 2021a). So it makes sense that 2020 car sales “soared” in the used market and fell in the new; one commentator provocatively notes, “a used car bought a year ago is worth more now [in January 2021]” (WSJ 2021b).
A surging used car market galvanizes wholesale auto auctions. Even prior to recent times, auction purchasing decisions were uncertain and demanding. Among 10 vehicles purchased at wholesale auto auction, 1 turns out to be a lemon, on average.1 A prospective purchase may provide 25 pieces of information to a decision-maker.2 The fast-paced market calls for increasingly effective purchasing decisions.
Solution: Decision Support with Machine Learning
Effective decision support looks like, contributing information to a broader assessment. My data science product rigorously predicts an auctioned vehicle’s “lemon probability,” using its characteristics. The complete decision support system involves:
A predictive model, which intakes a vehicle’s characteristics and outputs probability of being a lemon. This machine learning model learns patterns from 70,000 historical transactions. It may be custom-tuned to match a decision-maker’s objectives/risk tolerance.
A user interface, allowing seamless interaction with the predictive model. A mockup follows:
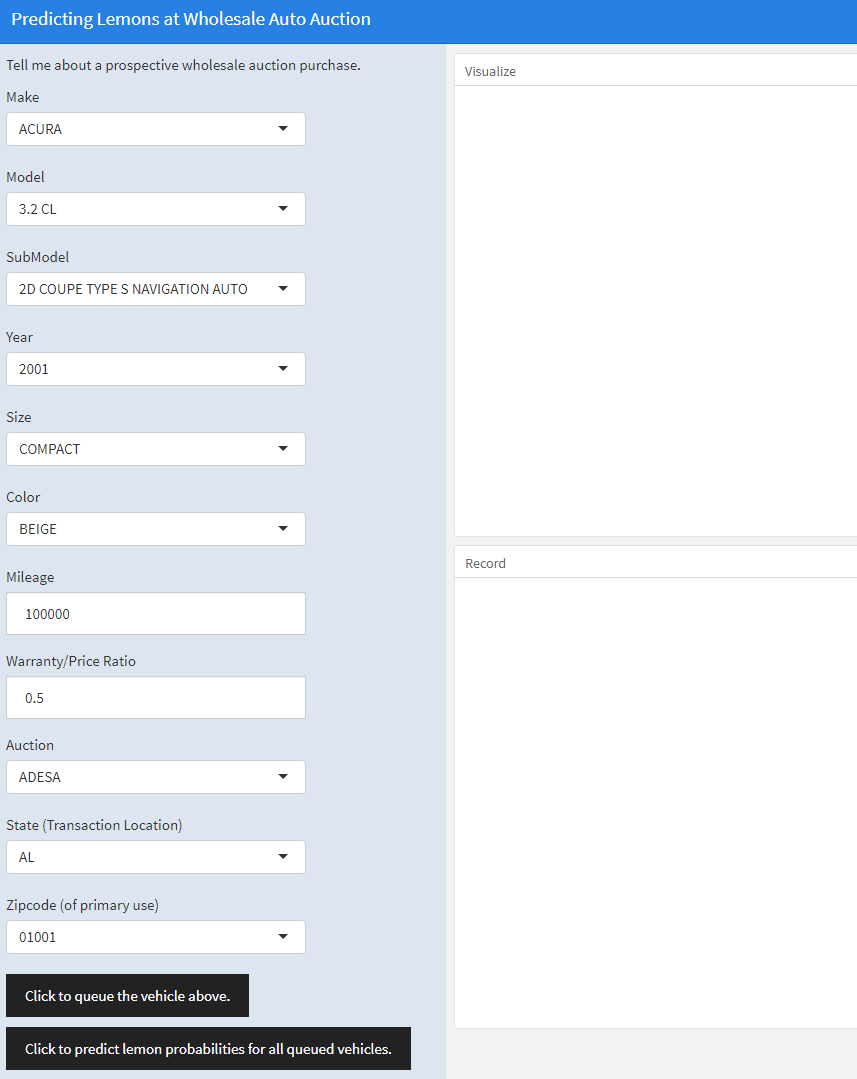
Figure 1: Model interface mockup.
In this post, I verify my predictive model prototype (point 1). Model verification must precede any real use; the model is the engine of the decision support system. Performance has been promising. In January 2021 I submitted model predictions to the associated Kaggle competition, and the work ranked 90th percentile on the archived global leaderboard.
About My Predictive Model Prototype
Why Machine Learning?
This problem invites a machine learning approach under a general-purpose reason: theory weakly anticipates predictor-outcome relationships.
For example, consider the relationship between mileage and lemon probability. Increasing mileage generally implies greater wear, and therefore greater lemon probability. This theory offers general guidance, but it quickly loses precision in the real world. For one, the relationship likely evolves over the range of mileage. Perhaps at low mileage, one hundred additional miles do not meaningfully increase lemon probability. Moreover, nothing has yet been mentioned of Make, Model, and age. These factors should also influence the link between mileage and lemon probability.
When it’s hard to fully articulate how predictors map to an outcome, the computing power of machine learning may help. Given data, an algorithm can conduct automated searches for predictor-outcome relationships. Processing may even entail constructing better predictors from the original ones. Automation unlocks rich modeling possibilities, practically unattainable under manual methods.
Strong Performance Helps Verify
I adopt a particular measure of model performance: rank on the associated Kaggle competition’s archived global leaderboard. Scoring follows a specific measure of prediction accuracy. Tuning my algorithm to optimize that scoring measure, my submitted predictions rank 90th percentile, in a field of more than 500 competitors.
I gladly provide supporting evidence for my claim:
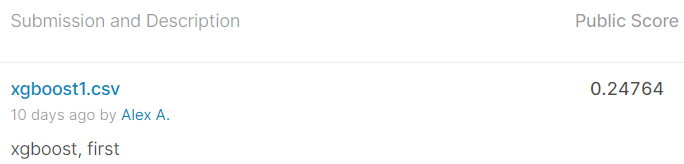
Figure 2: My submission’s score.

Figure 3: My public leaderboard position, among more than 500 total competitors.
This particular model tuning delivers an approximately 25% true positive rate and <1% false positive rate.
Logical Interpretations Arise
Broadly speaking, there exists a trade-off between model interpretability and predictive power. Intuitively, as one predictor-outcome relationship increasingly depends on other predictors’ values, that former relationship becomes harder to summarize.
In the model’s current state, I favor predictive power. The model learns at least a bit from most every predictor. Headline takeaways follow from a fundamental predictor importance measure.3
“Wheel type” is a highly influential predictor – particularly when missing, and not with a typical value like Alloy. This phenomenon almost certainly lacks a mechanical explanation. Most importantly, the machine learning model detects this pattern, and predictions strongly benefit. Bigger picture, this is a data quirk in the prototype setting. Perhaps it’s explained by a data retrieval quirk as Carvana initialized the competition. Or, perhaps likelier, Carvana applied this strange encoding to restrict analysts from directly acting on model conclusions.
Age and Make-Model meaningfully influence lemon probability, exactly as intuition suggests.
For the most influential price indicator, examine relative warranty cost: warranty cost divided by sale price. Intuitively, rising relative warranty cost should imply rising lemon probability.
These model-based assessments align clearly with my previous exploratory data analysis.
Algorithm Choice: Gradient Boosting (Technical)
This subsection offers some technical detail about my predictive model.
Following comprehensive data pre-processing, a gradient boosted tree model delivers strongest competition performance. Structurally, I sum relatively shallow decision trees – tree depth of 3 works well. I also scale down the default learning rate by a factor of 10. I utilize R’s implementation of xgboost, which leverages parallelization for remarkable speed boosts over gbm.
When contemplating this model’s effectiveness, I lean on the method’s distinct properties. It’s well-understood that the boosting procedure effectively (a) constructs new predictors from originals, and (b) up-weights cases of prediction errors. So it appears that, this prediction problem benefits from richer data representation under mechanism (a), and increasing responsiveness to errors under (b).
Delivery of Additional Code
As often described, model-building is the fun and easy part of this data analysis. Developing the data preparation pipeline is the hard, time-consuming part. I emphasize both parts in my overall code development. In particular, I deliver an automated data preparation pipeline and an R package of general subroutines.
References
WSJ. 2021a. “Ford, Other Auto Makers Cut Output, Idle Workers on Chip Shortage.” URL: www.wsj.com/articles/ford-other-auto-makers-cut-output-on-chip-shortage-11610280001.
———. 2021b. “Markets Rally Highlights Bets on Recovery.” URL: www.wsj.com/articles/markets-rally-highlights-bets-on-recovery-11610274601.
Sources: Featured Carvana dataset, author’s calculations. Years examined are 2009 and ’10.↩︎
For examples of available vehicle information, please see my previous post: alextabraham.com/post/2020-10-09-predictlemonswholesaleauction/.↩︎
This predictor importance measure quantifies the following: when the model incorporates this predictor, what’s the accuracy gain? For more, see xgboost.readthedocs.io/en/latest/R-package/discoverYourData.html.↩︎