How's Your Favorite Restaurant Trending?
What’s your favorite restaurant? It’s probably your favorite because of current experience – great food, atmosphere, value, and so on. But how do you anticipate future experience? How do you assess where a restaurant is trending?
A restaurant’s trend hints at future direction: what might it be like in 6 months or 1 year? We can quantify restaurant trend with data. Restaurant trend scores open exciting new possibilities for restaurant promotion and discovery.
To see for yourself, check out the interactive web app! (Trend scores are available for restaurants with enough history.)
This post shows how restaurant trend scores may be learned from an underutilized data source: food safety inspections.
Food Safety Inspections Tell Stories About Restaurant Trend
Food safety inspections tell meaningful stories about restaurant trend. So inspection data have clear application toward restaurant trend scores.
One restaurant’s headline inspection score can vary a lot over time:
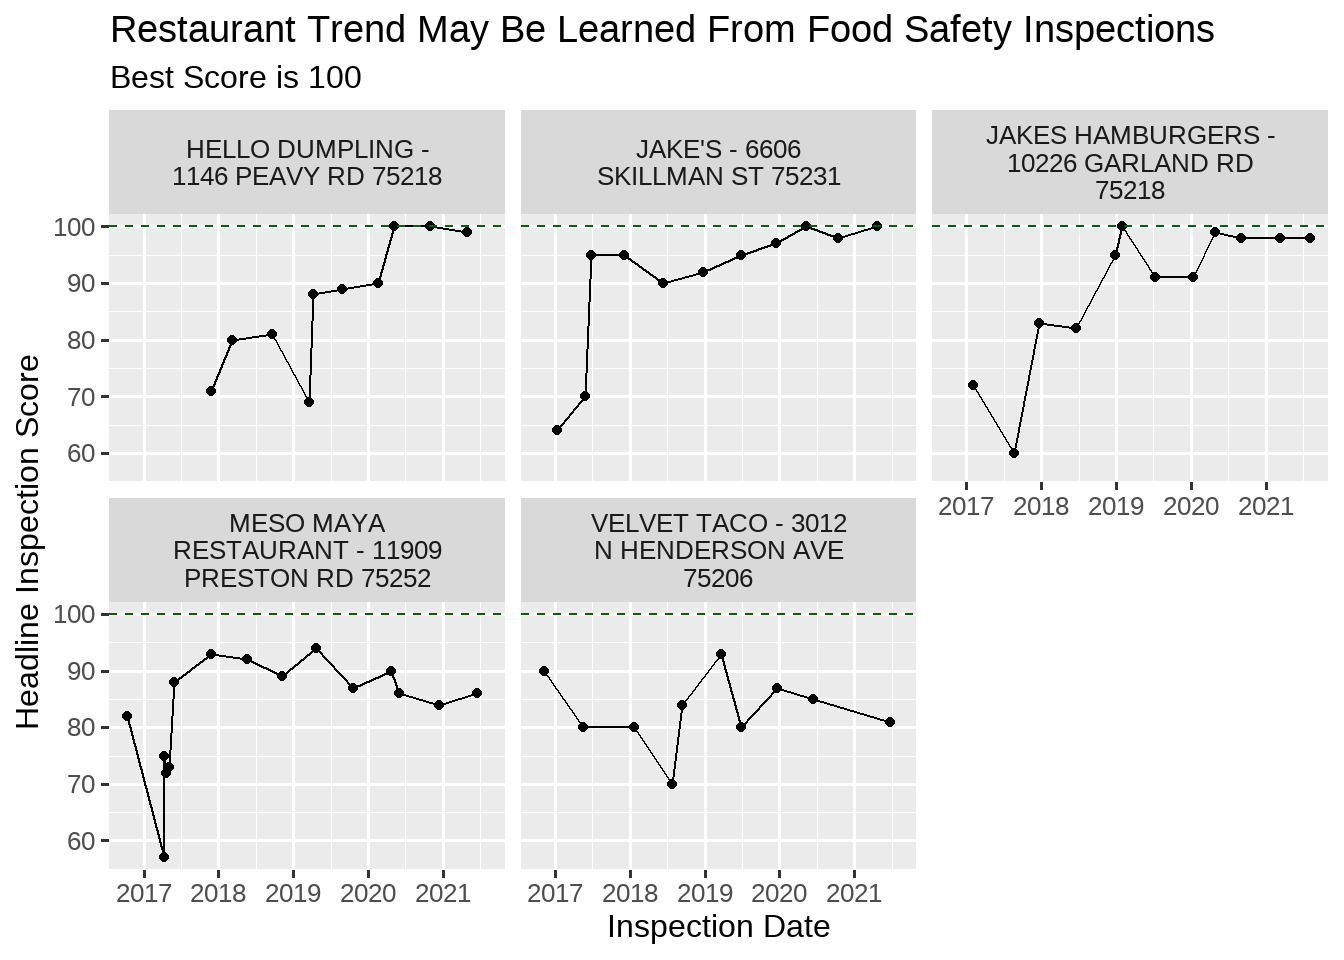
Start with the big picture idea. When a restaurant dramatically improves its inspection score, it possesses positive, upward trend. The future looks bright – optimism follows a track record of continual improvement.
For a more detailed story about restaurant trend, look to finer features of inspection history:
The headline inspection score has followed what kind of path – one of consistent improvement, or sharp changes?
What have been the long-run and short-run changes in score – from two years ago, and within the last year?
How about underlying inspection details – over time, are issues decreasing in significance? How frequent are repeat-issues?
As the above indicators improve – suggesting stronger upward trend, historically – a restaurant trend score also increases.
Food Safety Inspection Data Allow Regular Trend Score Updates
New food safety inspection data arrive monthly, allowing regular updates of restaurant trend scores. The Dallas data include rich details for many restaurant locations.
One Dallas restaurant location1 typically receives a health inspection every six months. Inspection details are publicly available via Dallas OpenData. One inspection records several measurements:
a headline inspection score (up to 100) quickly summarizes
the distinct point deductions from 100. Each one has a complete explanation.
From October 2016 to August 2021, Dallas OpenData has recorded about 57,000 inspection events. 9,000 locations have at least one inspection event, and almost 6,000 locations have six inspection events.
From Trend Indicators, a Model Learns Restaurant Trend Scores
A restaurant trend score summarizes historical trend positivity, from 0-100. A score of 100 indicates strongest upward trend within a peer group. To produce the score, a quantitative model learns from restaurant trend indicators.
Restaurant trend indicators include:
Long-run change in headline inspection score (the strongest driver of trend score)
Short-run change in headline inspection score
Change in inspection violations’ count and severity
Repeat violations’ severity
A quantitative model uses these indicators to learn trend scores, by peer group. One peer group contains restaurants at a certain tier of headline inspection score.
Explore the scores with the interactive web app! (Trend scores are available for restaurants with enough history.)
A statistical learning method powers restaurant trend scoring. One restaurant’s score is a weighted sum of trend indicator inputs. Those weights are learned by solving an optimization problem over the complete dataset. The weights are computed such that, the weighted-sum scores have maximum variability (measured by statistical variance).
One physical restaurant location may also be called an “establishment”.↩︎