Predicting Lemons at Wholesale Auto Auction (1)
Data Exploration
Key Takeaways
Around 2012, Carvana – a car retailer – posted wholesale auto auction transaction data, prompting analysts to predict whether a purchased vehicle would turn out to be a lemon. Historical data of this sort may help auction buyers avoid future lemons.
Preliminary insights follow from visual exploration of the data.
Why is this Case Study Worth a Read?
Among 10 cars purchased at wholesale auto auction, 1 turns out to be a lemon, on average.1 The associated cost scales rapidly over time and the population of car retailers. How can wholesale auto auction transaction data help buyers avoid future lemons? That is the exciting business question for the sold-at-wholesale auto auction data I examine.
About the Sold-at-Wholesale Auto Auction Data
Around 2012, Carvana – a car retailer – posted wholesale auto auction transaction data for a prediction competition. The instruction: “predict if a car purchased at auction is a lemon” (Kaggle 2012). Carvana defines a lemon as a car with “serious issues that prevent it from being sold to customers […] [such as] tampered odometers, mechanical issues the dealer is not able to address, issues with getting the vehicle title from the seller,” etc (Kaggle 2012).
How do these data look in a spreadsheet? What’s the structure? One row2 represents a vehicle purchased at auction. That row contains vehicle and transaction information which may help predict the key outcome: whether the vehicle turns out to be a lemon (“yes” or “no”). The data record approximately 70,000 auction purchases.
The data contain these potential predictors3 of whether a vehicle turns out to be a lemon:
| Description |
|---|
| Date of purchase |
| Auction |
| Manufacturer’s year |
| Years elapsed since the manufacturer’s year |
| Manufacturer |
| Model |
| Trim level |
| Submodel |
| Color |
| Transmission type |
| Wheel type |
| Odometer reading (mileage) |
| Manufacturer’s country |
| Size category |
| Expected price: in auction market, in average condition |
| Expected price: in auction market, in above-average condition |
| Expected price: in retail market, in average condition |
| Expected price: in retail market, in above-average condition |
| Auction’s level of guarantee |
| Buyer’s unique ID |
| Zipcode of purchase |
| State of purchase |
| Price |
| Purchase occurred online (yes/no) |
| Warranty price (term = 36-month and mileage = 36K) |
With relatively many possible predictors, how might the data analysis proceed? In my view, optimal data analysis combines theory and computational pattern-finding. Subject matter expertise (theory) should offer a general guide for quantitative modeling. However, that level of knowledge may not be specific enough to the data at hand. So theory and intuition also follow from exploring the available data: through charts, summary statistics, and so on4. I undertake this data exploration in the blog content that follows.
Data Exploration
Data exploration helps address critical questions which must precede any formal modeling.
- Do the values recorded in my data look reasonable? Are there obvious recording errors or ambiguities?
- How would I describe these data’s contents to a colleague, client, or friend?
- What relationships appear interesting, and what’s the intuition?
I find narrative-form data exploration especially insightful5.
Examine Categorical Variables’ Values
To begin, I select one variable and examine its values in a couple ways – (a) without regard for the lemon/not lemon outcome, or (b) by lemon/not lemon outcome.6 Intuitively, how do we recognize a true predictor of lemon status? Consider one value of that predictor, and then narrow focus to those cases in the data. If among those cases, the lemon rate differs notably versus its full-data average, that predictor (value) is informative.
I begin with variables that take categorical/discrete values. When examining cases by lemon/not lemon outcome, I also plot the full-data average lemon probability – about 12%.
Manufacturer’s Year
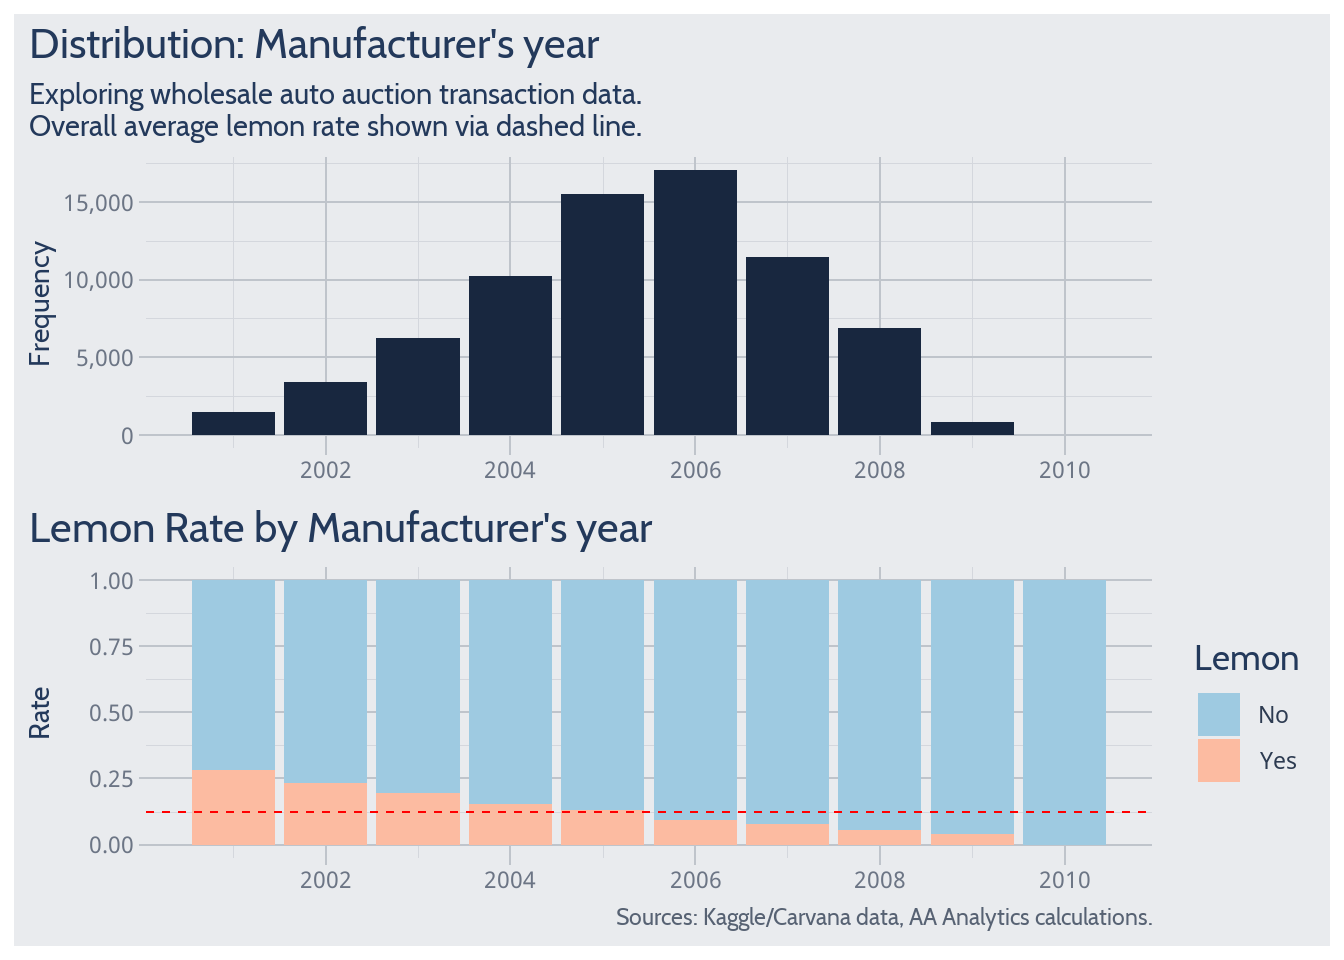
For example – the above chart shows that among vehicles with manufacturer year of 2001, about 25% turn out to be lemons. Broadly, older vehicles have above-average lemon rates. Didn’t need a quantitative analyst to tell you that!
Manufacturer (Make)
We learn about peculiar wholesale auction dynamics when exploring by manufacturer (Make).
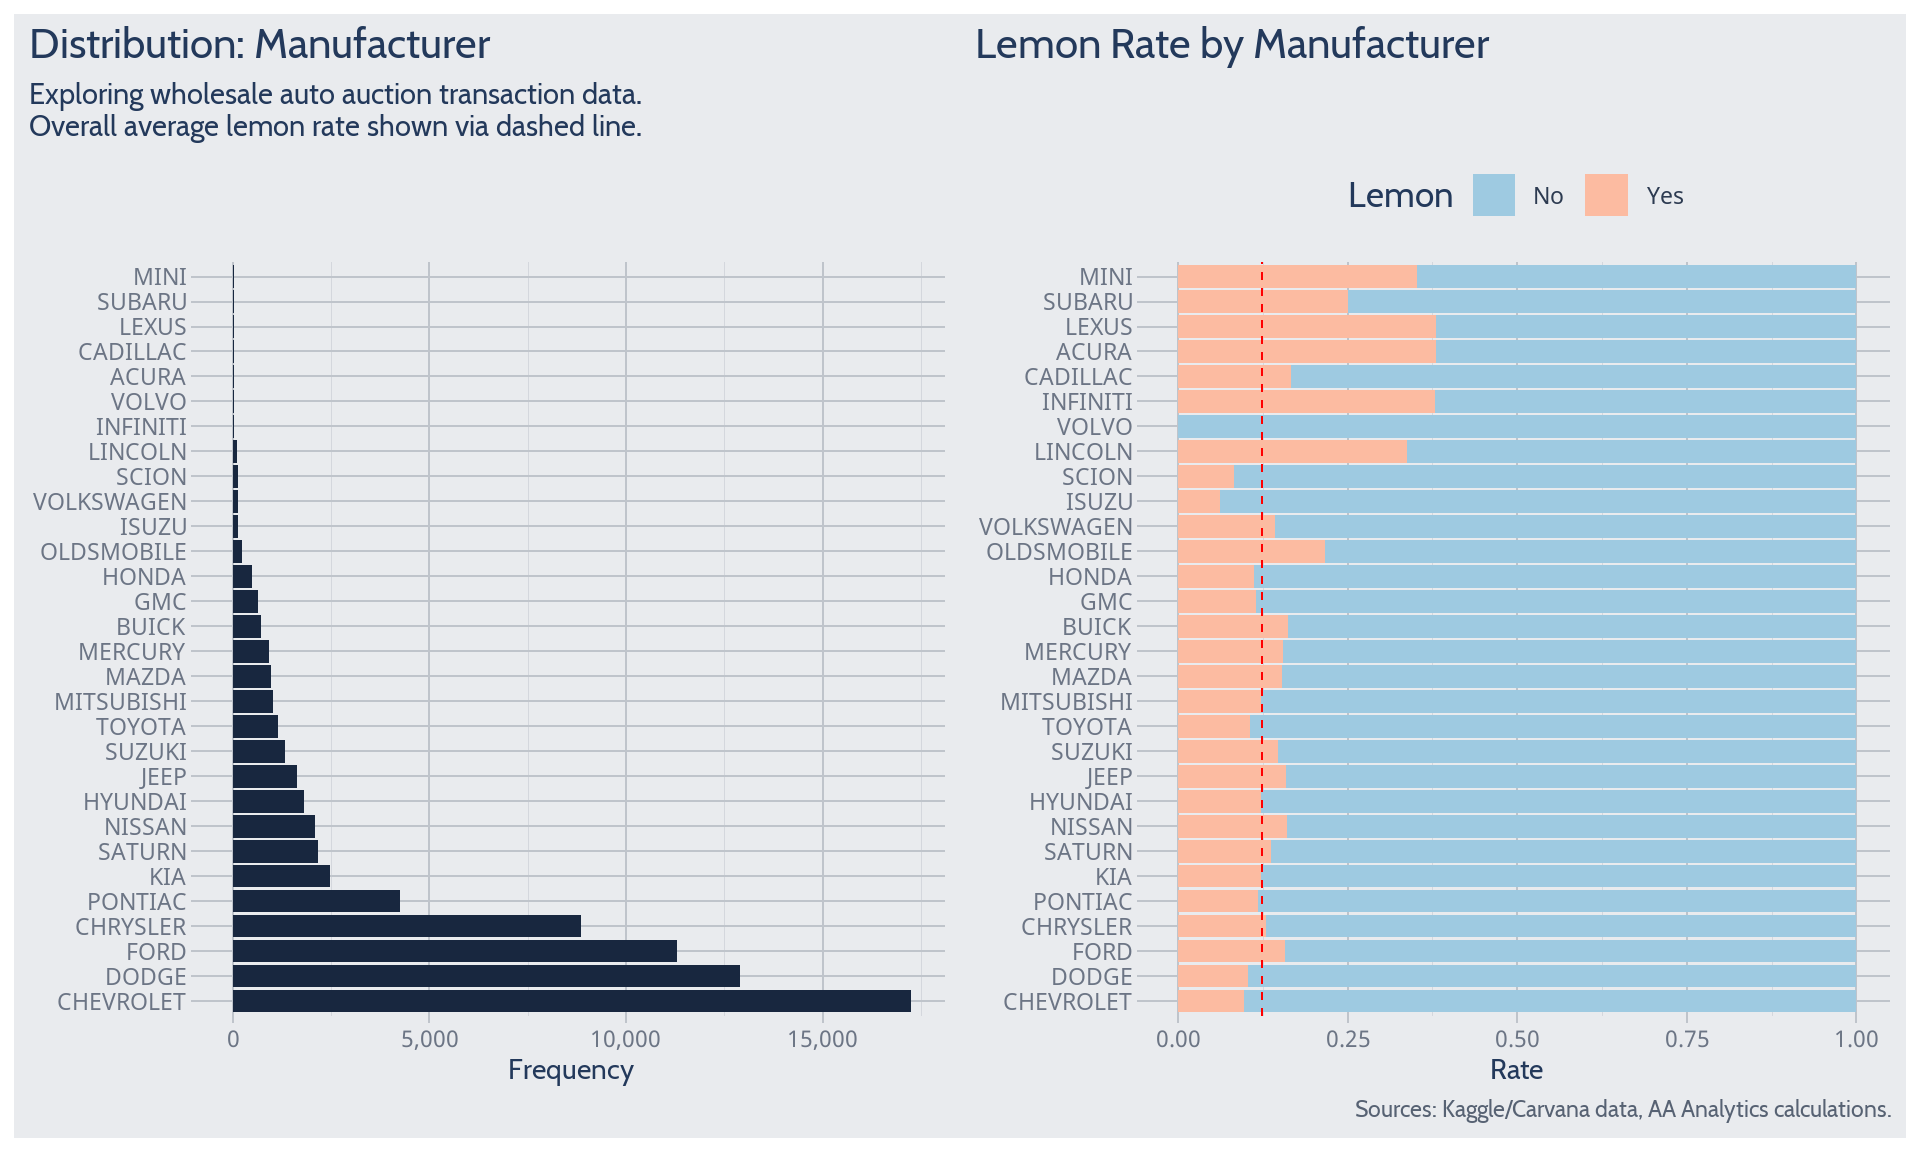
Begin with the by-Make counts, which help inform uncertainty about by-Make expectations. Intuitively, after we observe many cars from a Make, we’re more certain about what to expect from that Make. Conversely, if we’ve observed few cars from a Make, we’re highly uncertain about what to expect – the baseline could change significantly with only a couple more observations.
For example, the data inform fairly certain expectations for Chevrolet, Dodge, Ford, or Chrysler. For many Makes, though, the data are not very informative about what to expect. How could we try and make a highly uncertain expectation less wrong? Lower error may result when an expectation down-weights inconclusive data and incorporates other information. Statistics calls this paradigm the bias-variance trade-off.
Proceed to average lemon rates by Make. These reveal the peculiar, counter-intuitive nature of vehicles sold at wholesale auction. For example, luxury brands tend to have above-average lemon rates. Why? The phenomenon of adverse selection may explain. If a luxury vehicle makes it to wholesale auction, that vehicle is likely anomalous in an unpleasant way. Of course, luxury brands constitute a small fraction of all transactions. Among Makes more frequently observed, the lemon rate appears to differ significantly from its overall average.
Size Category
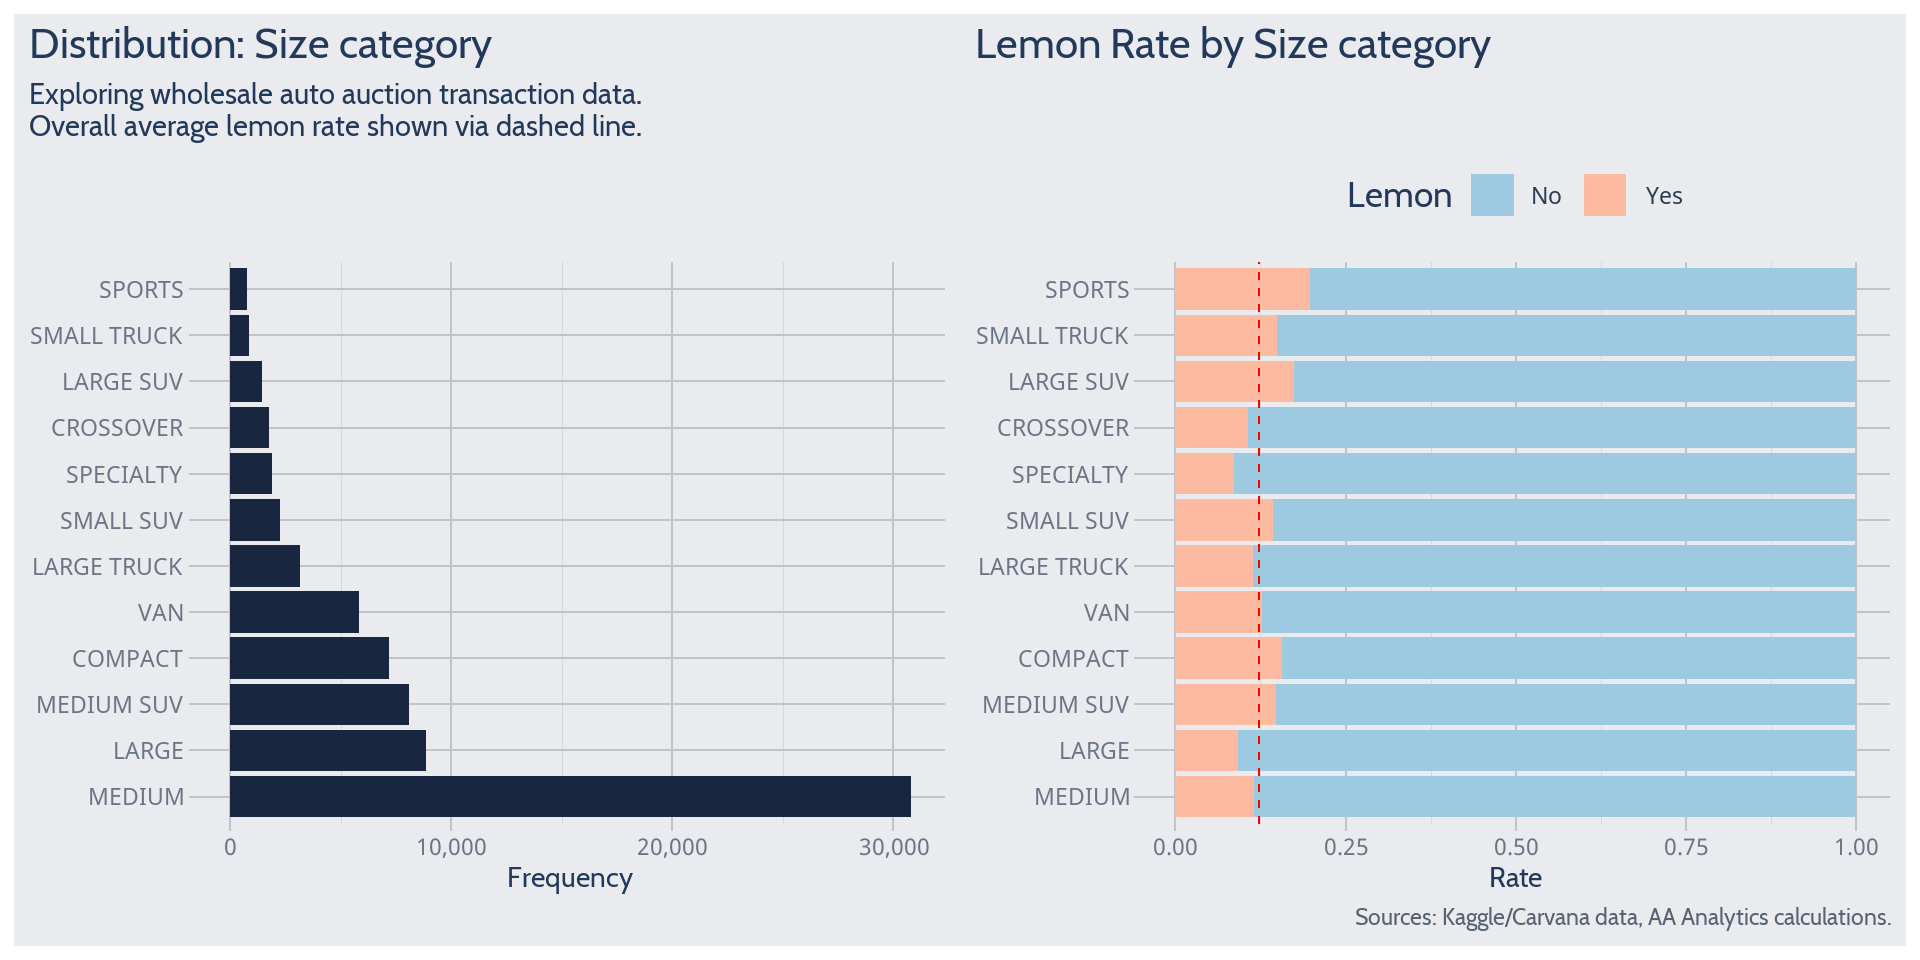
Most observed vehicles have a sedan-like size. Among sizes seen more often, the lemon rate appears to differ significantly from its overall average.
Transmission Type
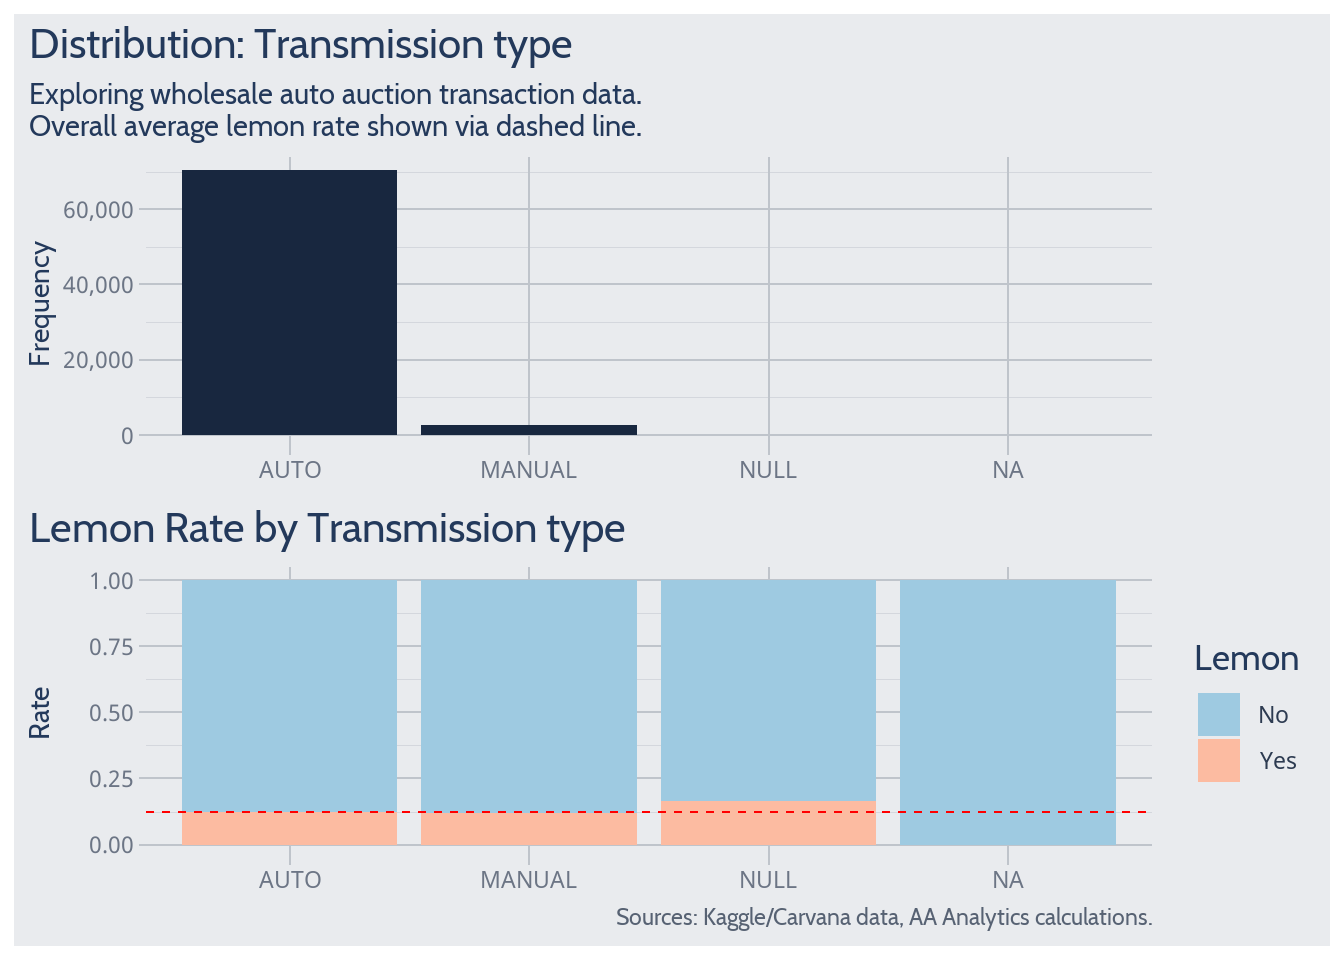
Among transmission types often observed, the lemon rate does not appear to differ much from its overall average. So transmission type doesn’t appear to predict lemon probability.
Color
Color lacks a clear theoretical relationship with lemon probability. Perhaps cars with heavy wear-and-tear have also been painted with aftermarket colors? Nonetheless, it is worth checking for any data surprises.
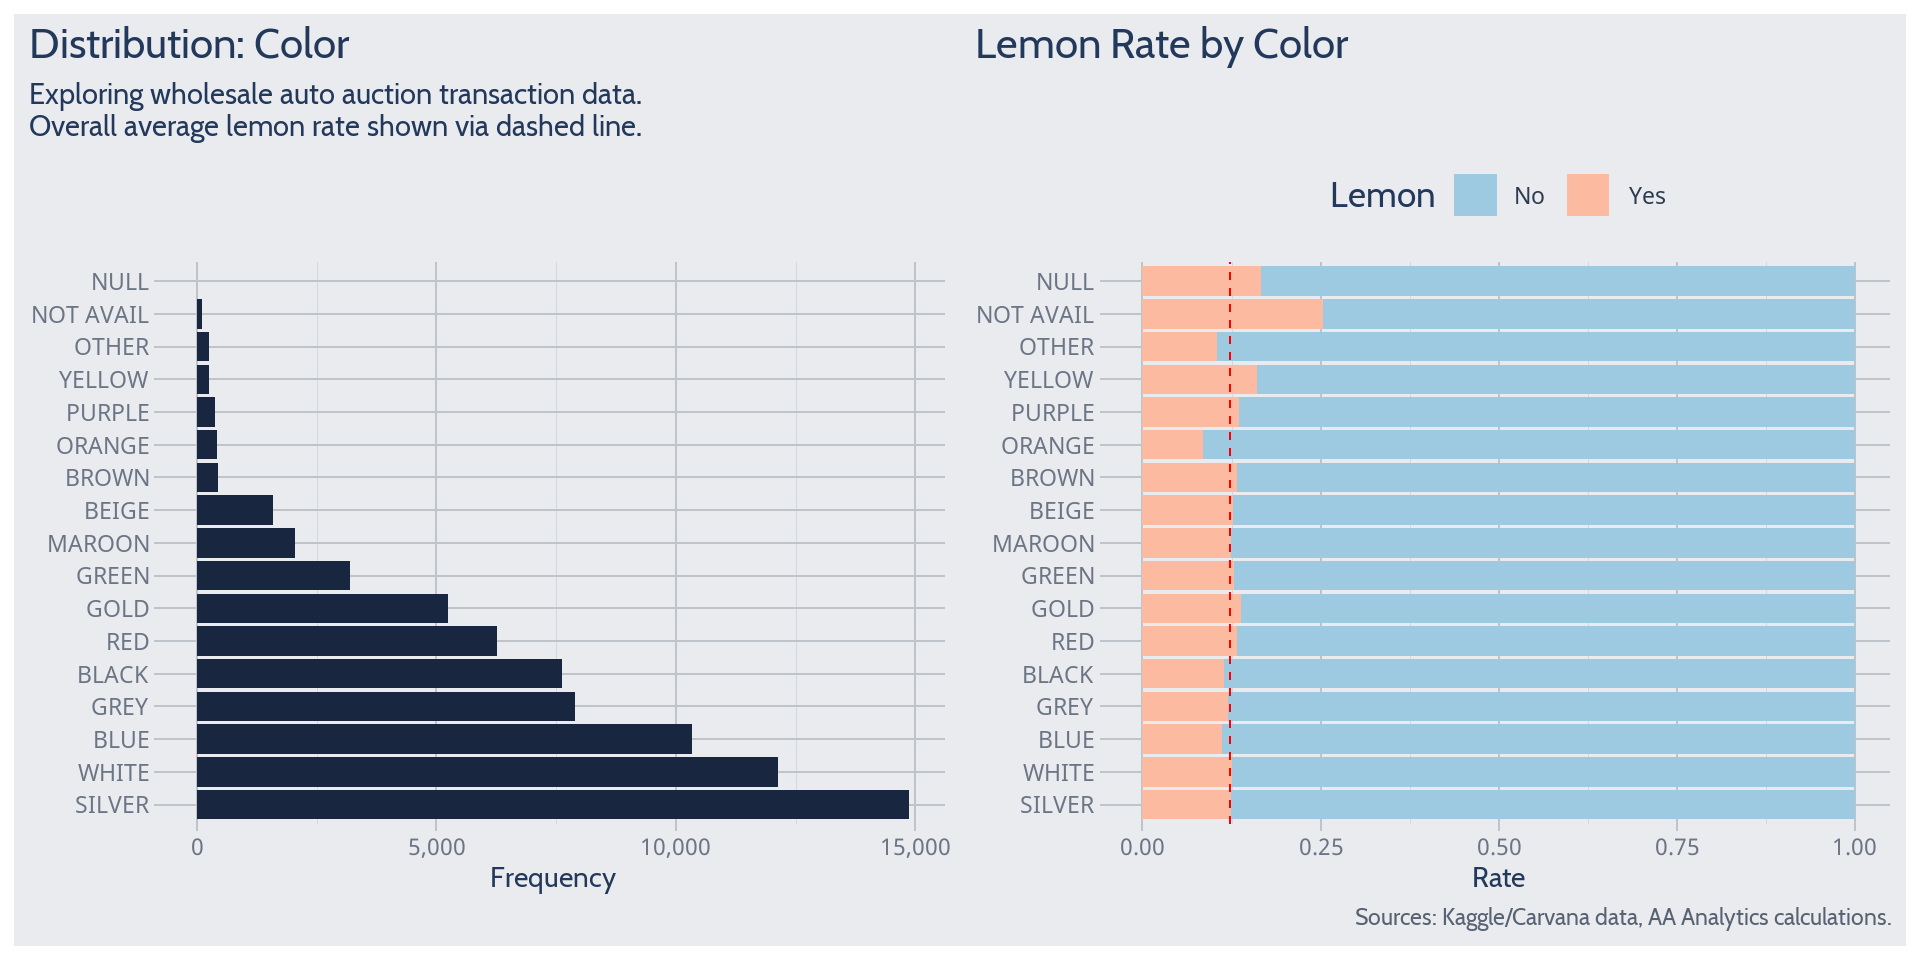
Among colors often observed, the lemon rate does not appear to differ much from its overall average. So color is likely unhelpful as a predictor of lemon probability.
Wheel Type
Wheel type lacks a clear theoretical relationship with lemon probability. So initially the variable may not seem to deserve investigation. However, in this case, hands-on data exploration reveals an intriguing pattern. This is an example where data exploration/understanding yields great return, which theory alone would miss.
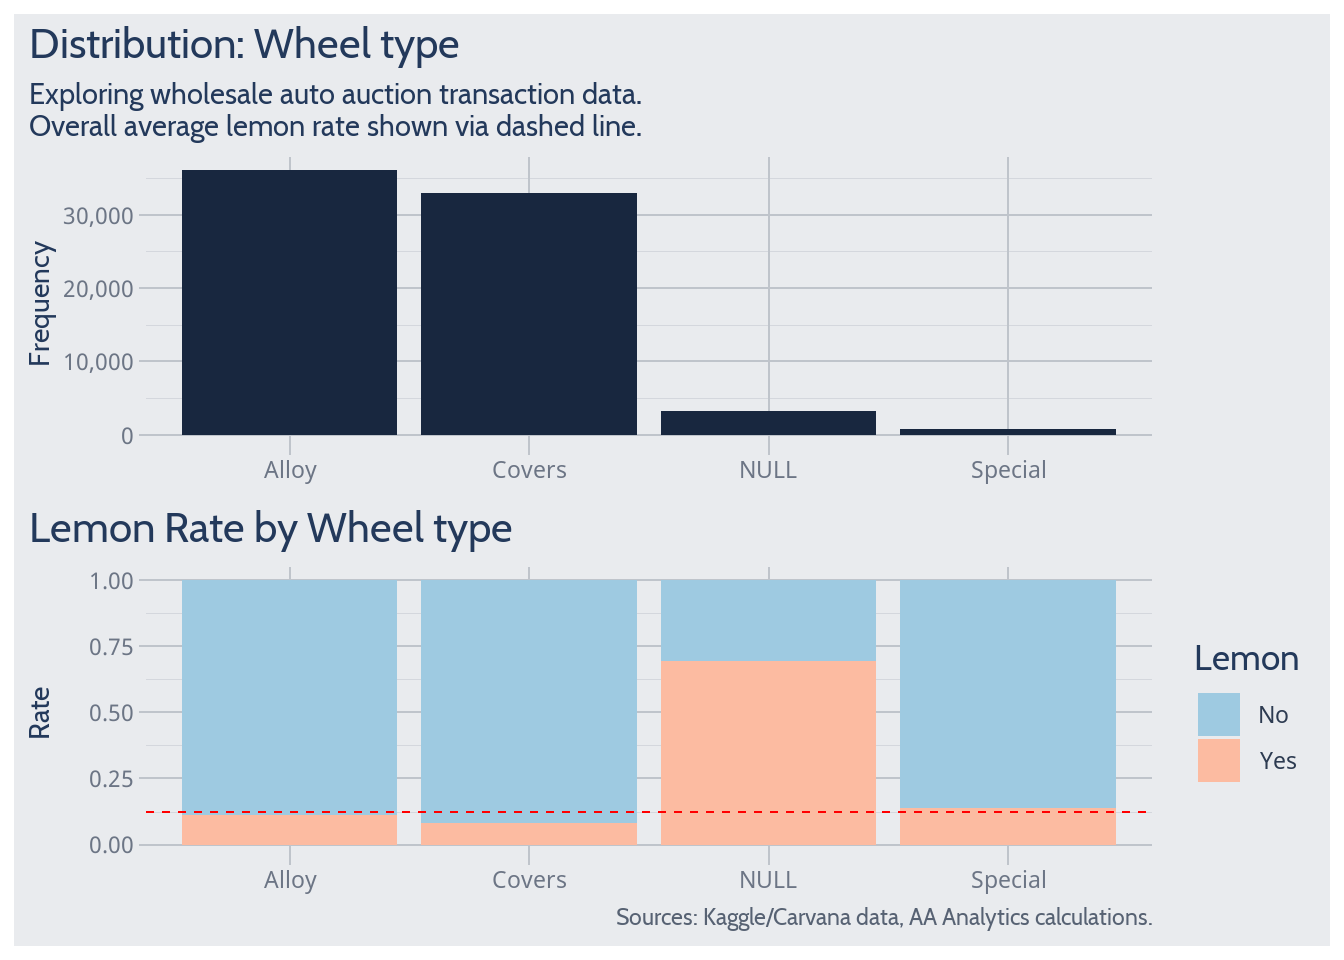
When wheel type is coded NULL, the lemon rate jumps far above-average. Why? Simply put, here is a data quirk. Perhaps NULL wheel type proxies for some troublesome mechanical phenomenon. Perhaps a data entry fluke tends to occur for troublesome vehicles. Whatever the truth of it, unnecessary downside risk haunts a lemon prediction which ignores wheel type.
Auction
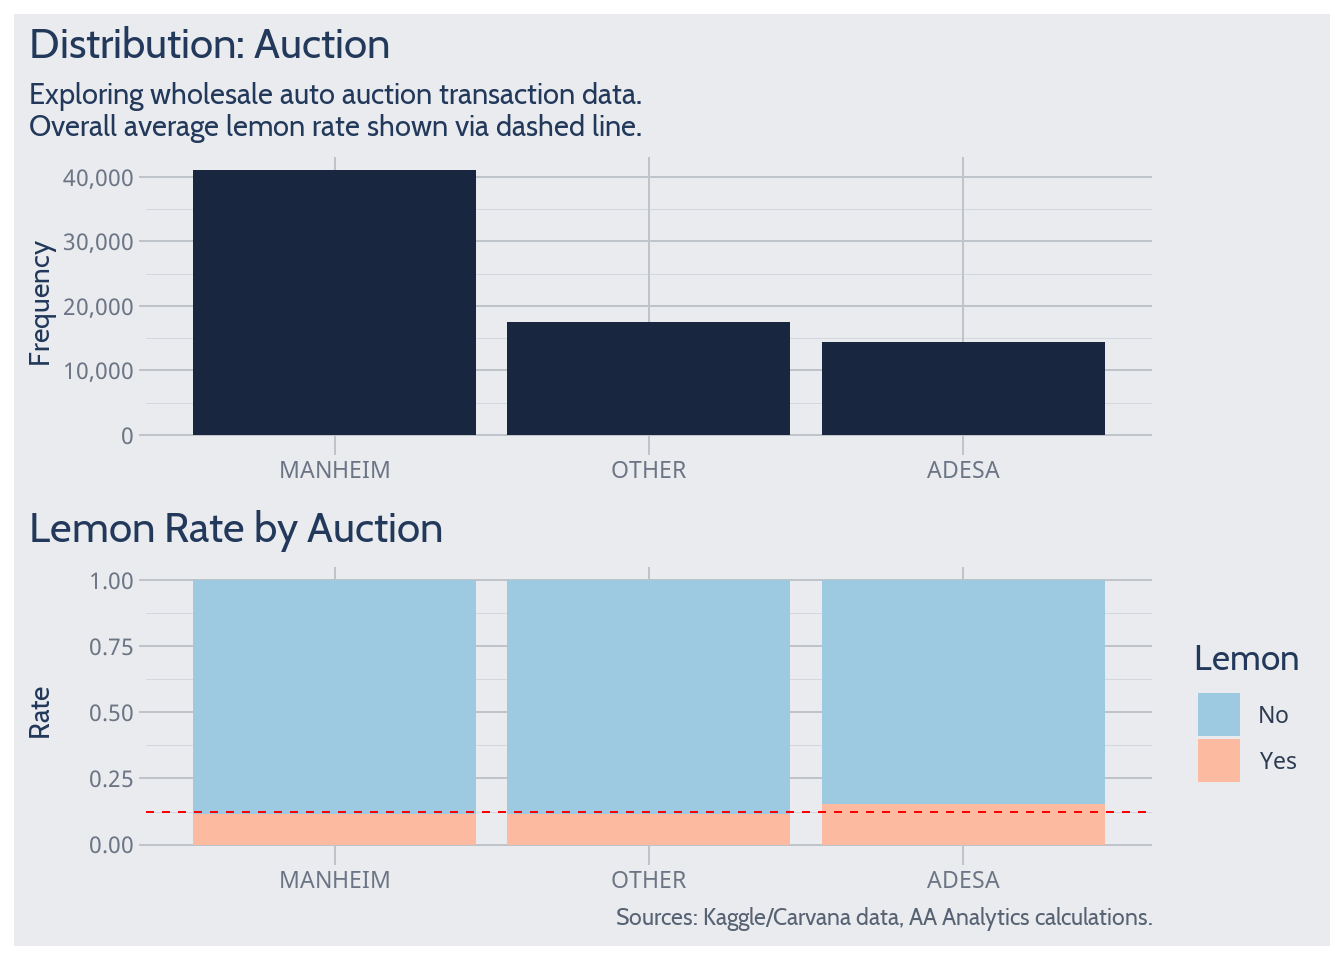
On average, a bit more lemon risk may be incurred by purchasing from Adesa.
Auction’s Level of Guarantee
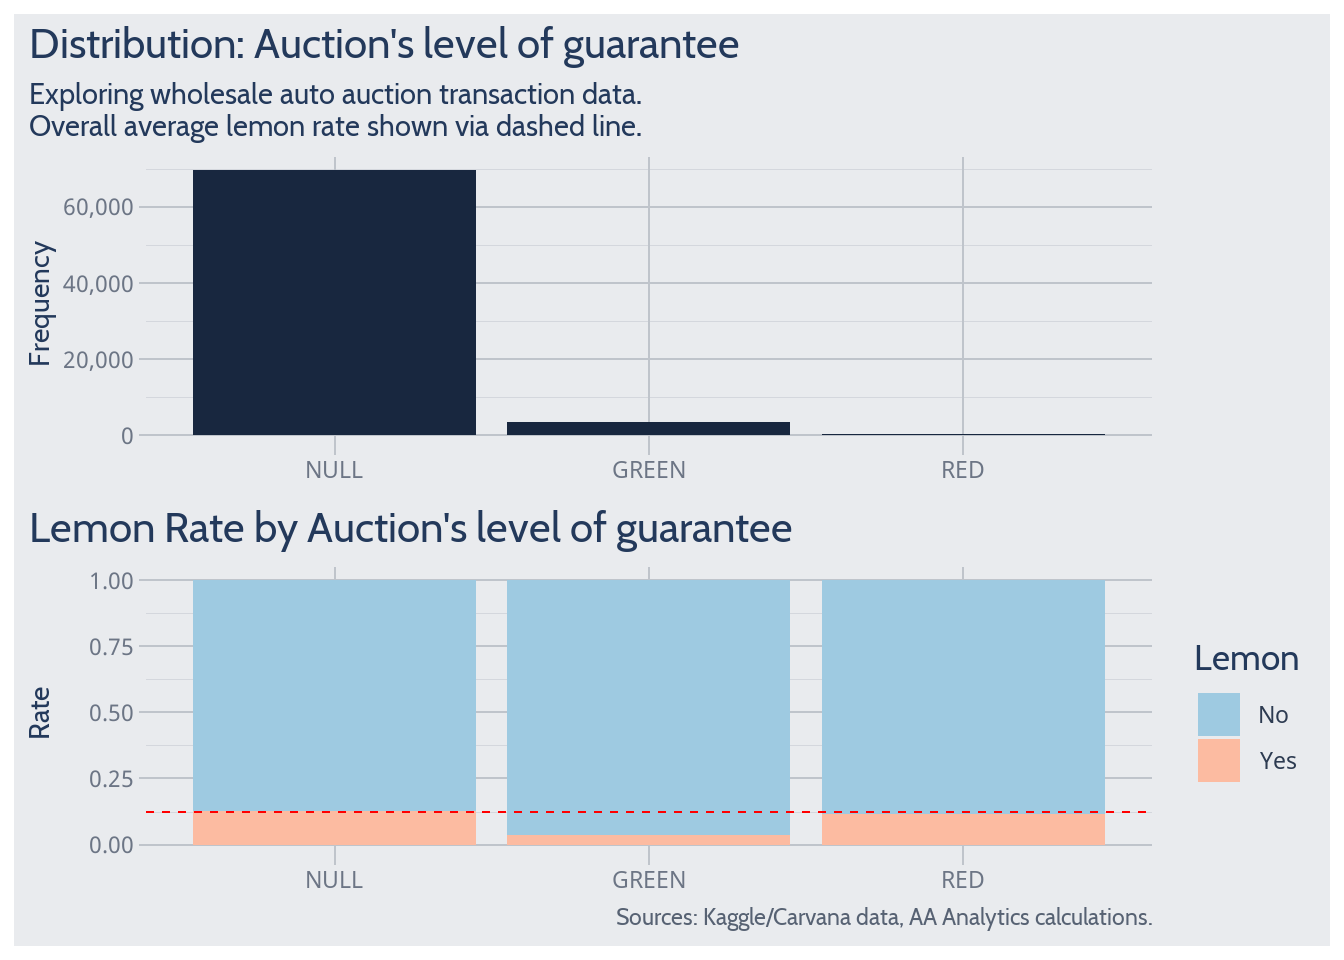
For a ‘Green’ guarantee, the lemon rate drops substantially from its overall average. Similar to the study of wheel type, level of guarantee may help predict not-lemon probability in those special ‘Green’ cases.
Purchase Occurred Online
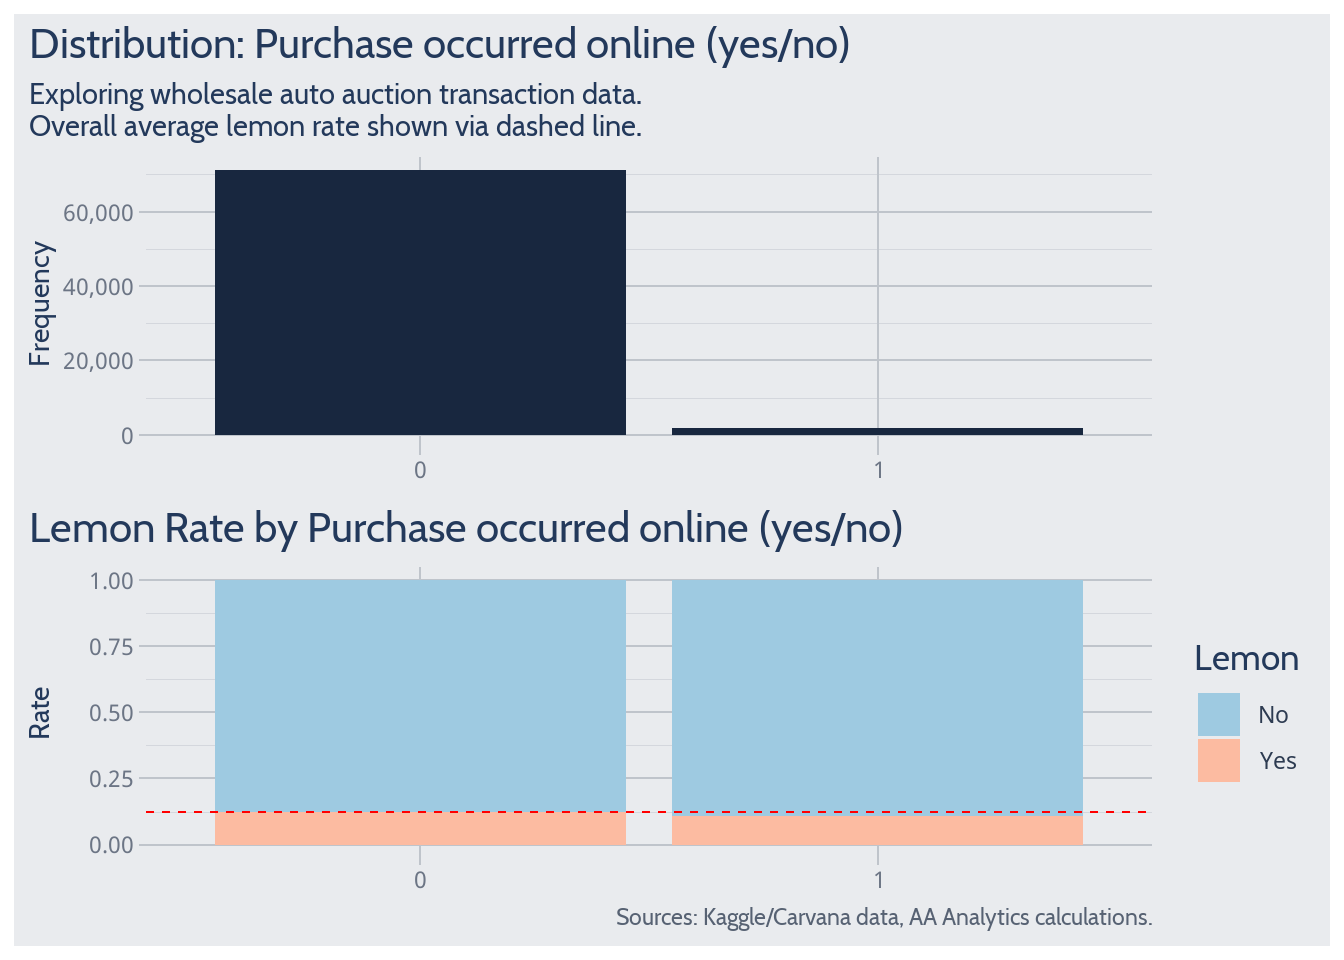
By transaction forum, the lemon rate does not appear to differ much from its overall average. So transaction forum doesn’t appear to predict lemon probability.
State
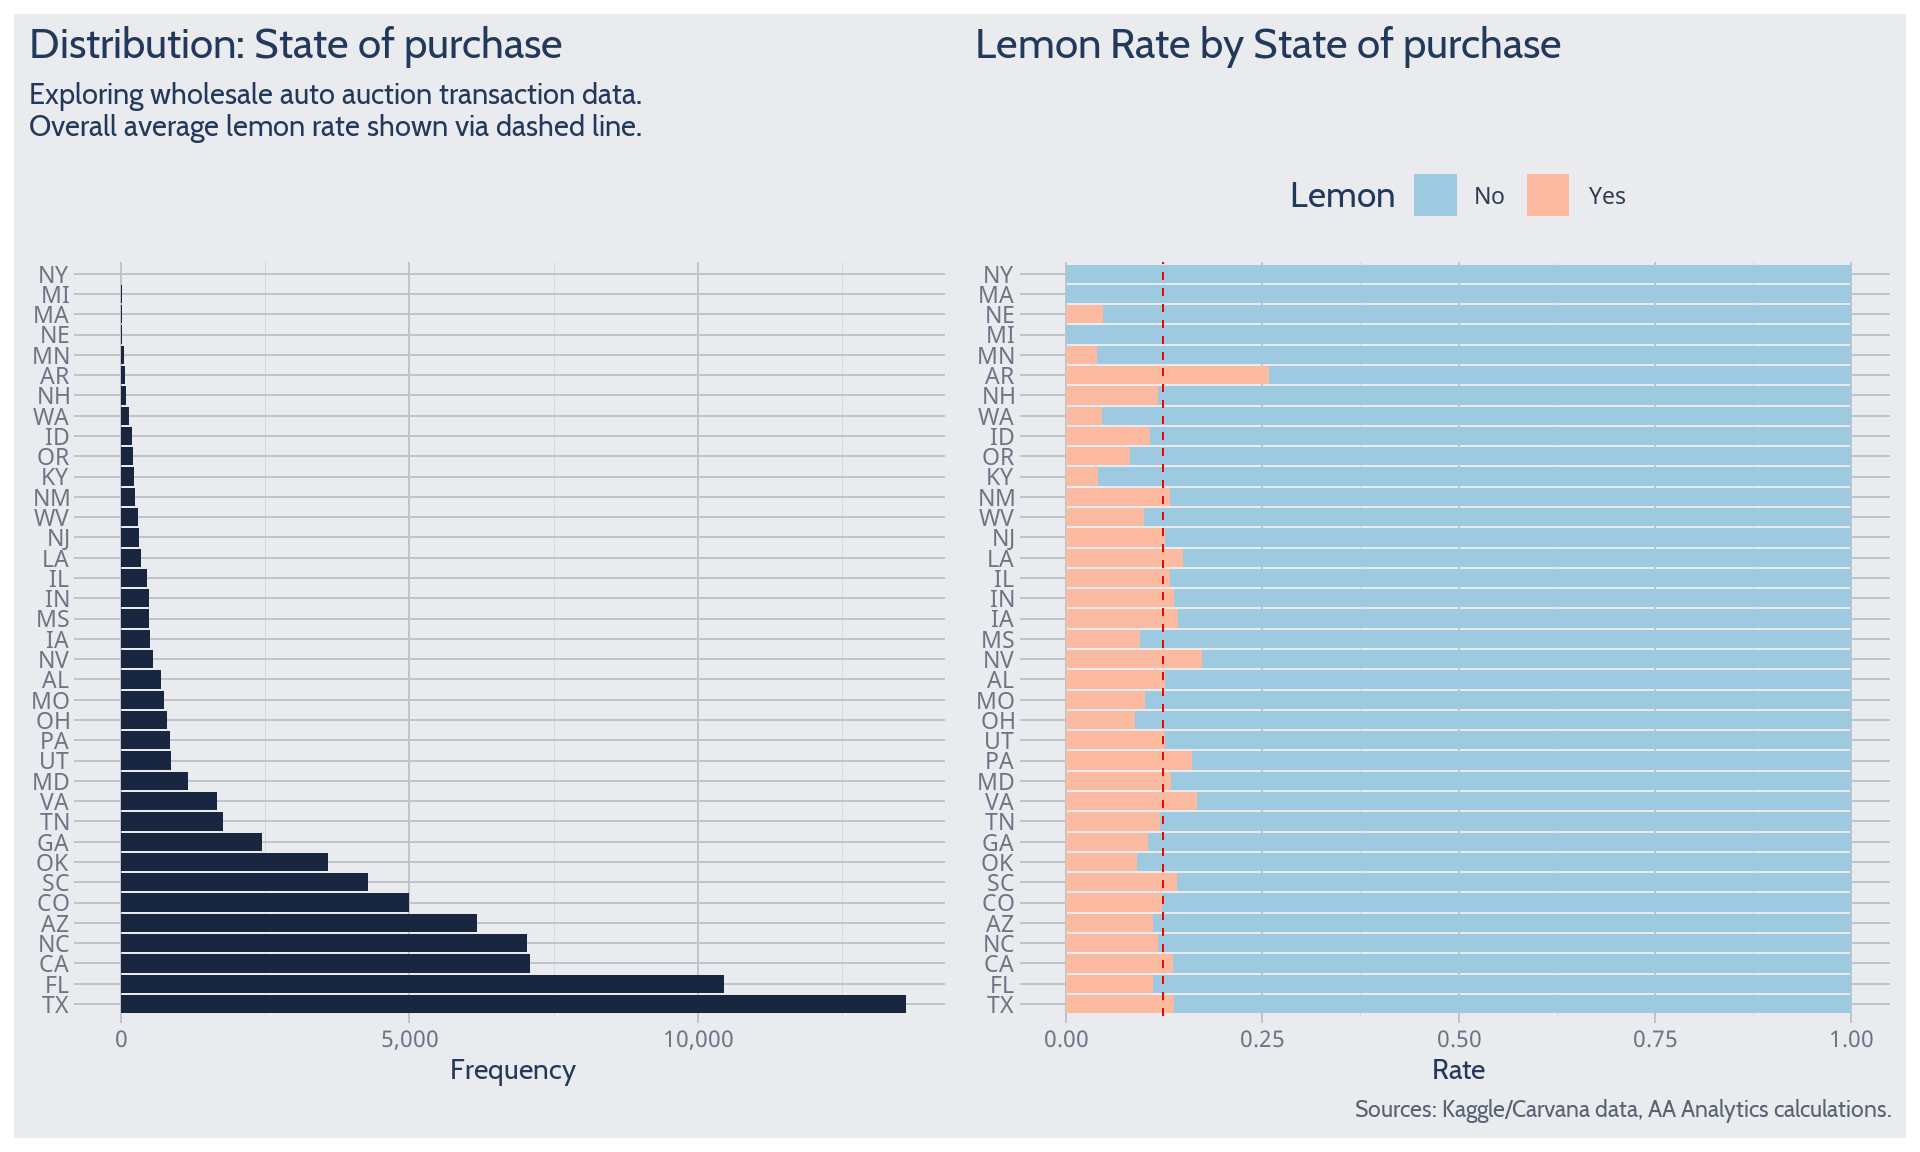
State of purchase contains many categorical values, like Make did previously. So the analytical approach for Make may be adapted here.
Frequency counts suggest fairly certain expectations may follow for a handful of states. To name a clear few, these include Texas, Florida, California, and North Carolina. On the other hand, the data support only weakly certain expectations for fairly many states. For instance, few New York or Illinois cases are observed.
State-to-state, the lemon rate appears to differ significantly from its overall average. So state of purchase may help predict lemon probability.
Examine Numeric Variables’ Values
Purchase Price Ratios
Price variables are interesting when considered in a particular form. It seems reasonable to theorize that if a vehicle carries higher lemon risk, it’s sold “cheap” at auction. But how might “cheap” or “expensive” be quantified? One metric I create is a ratio of actual purchase price to peer group expected price. There are different peer group expected price series, allowing a few calculation variants.
Another ratio worth examining is warranty price to actual purchase price. As a vehicle’s lemon risk increases, it likely costs more to insure.
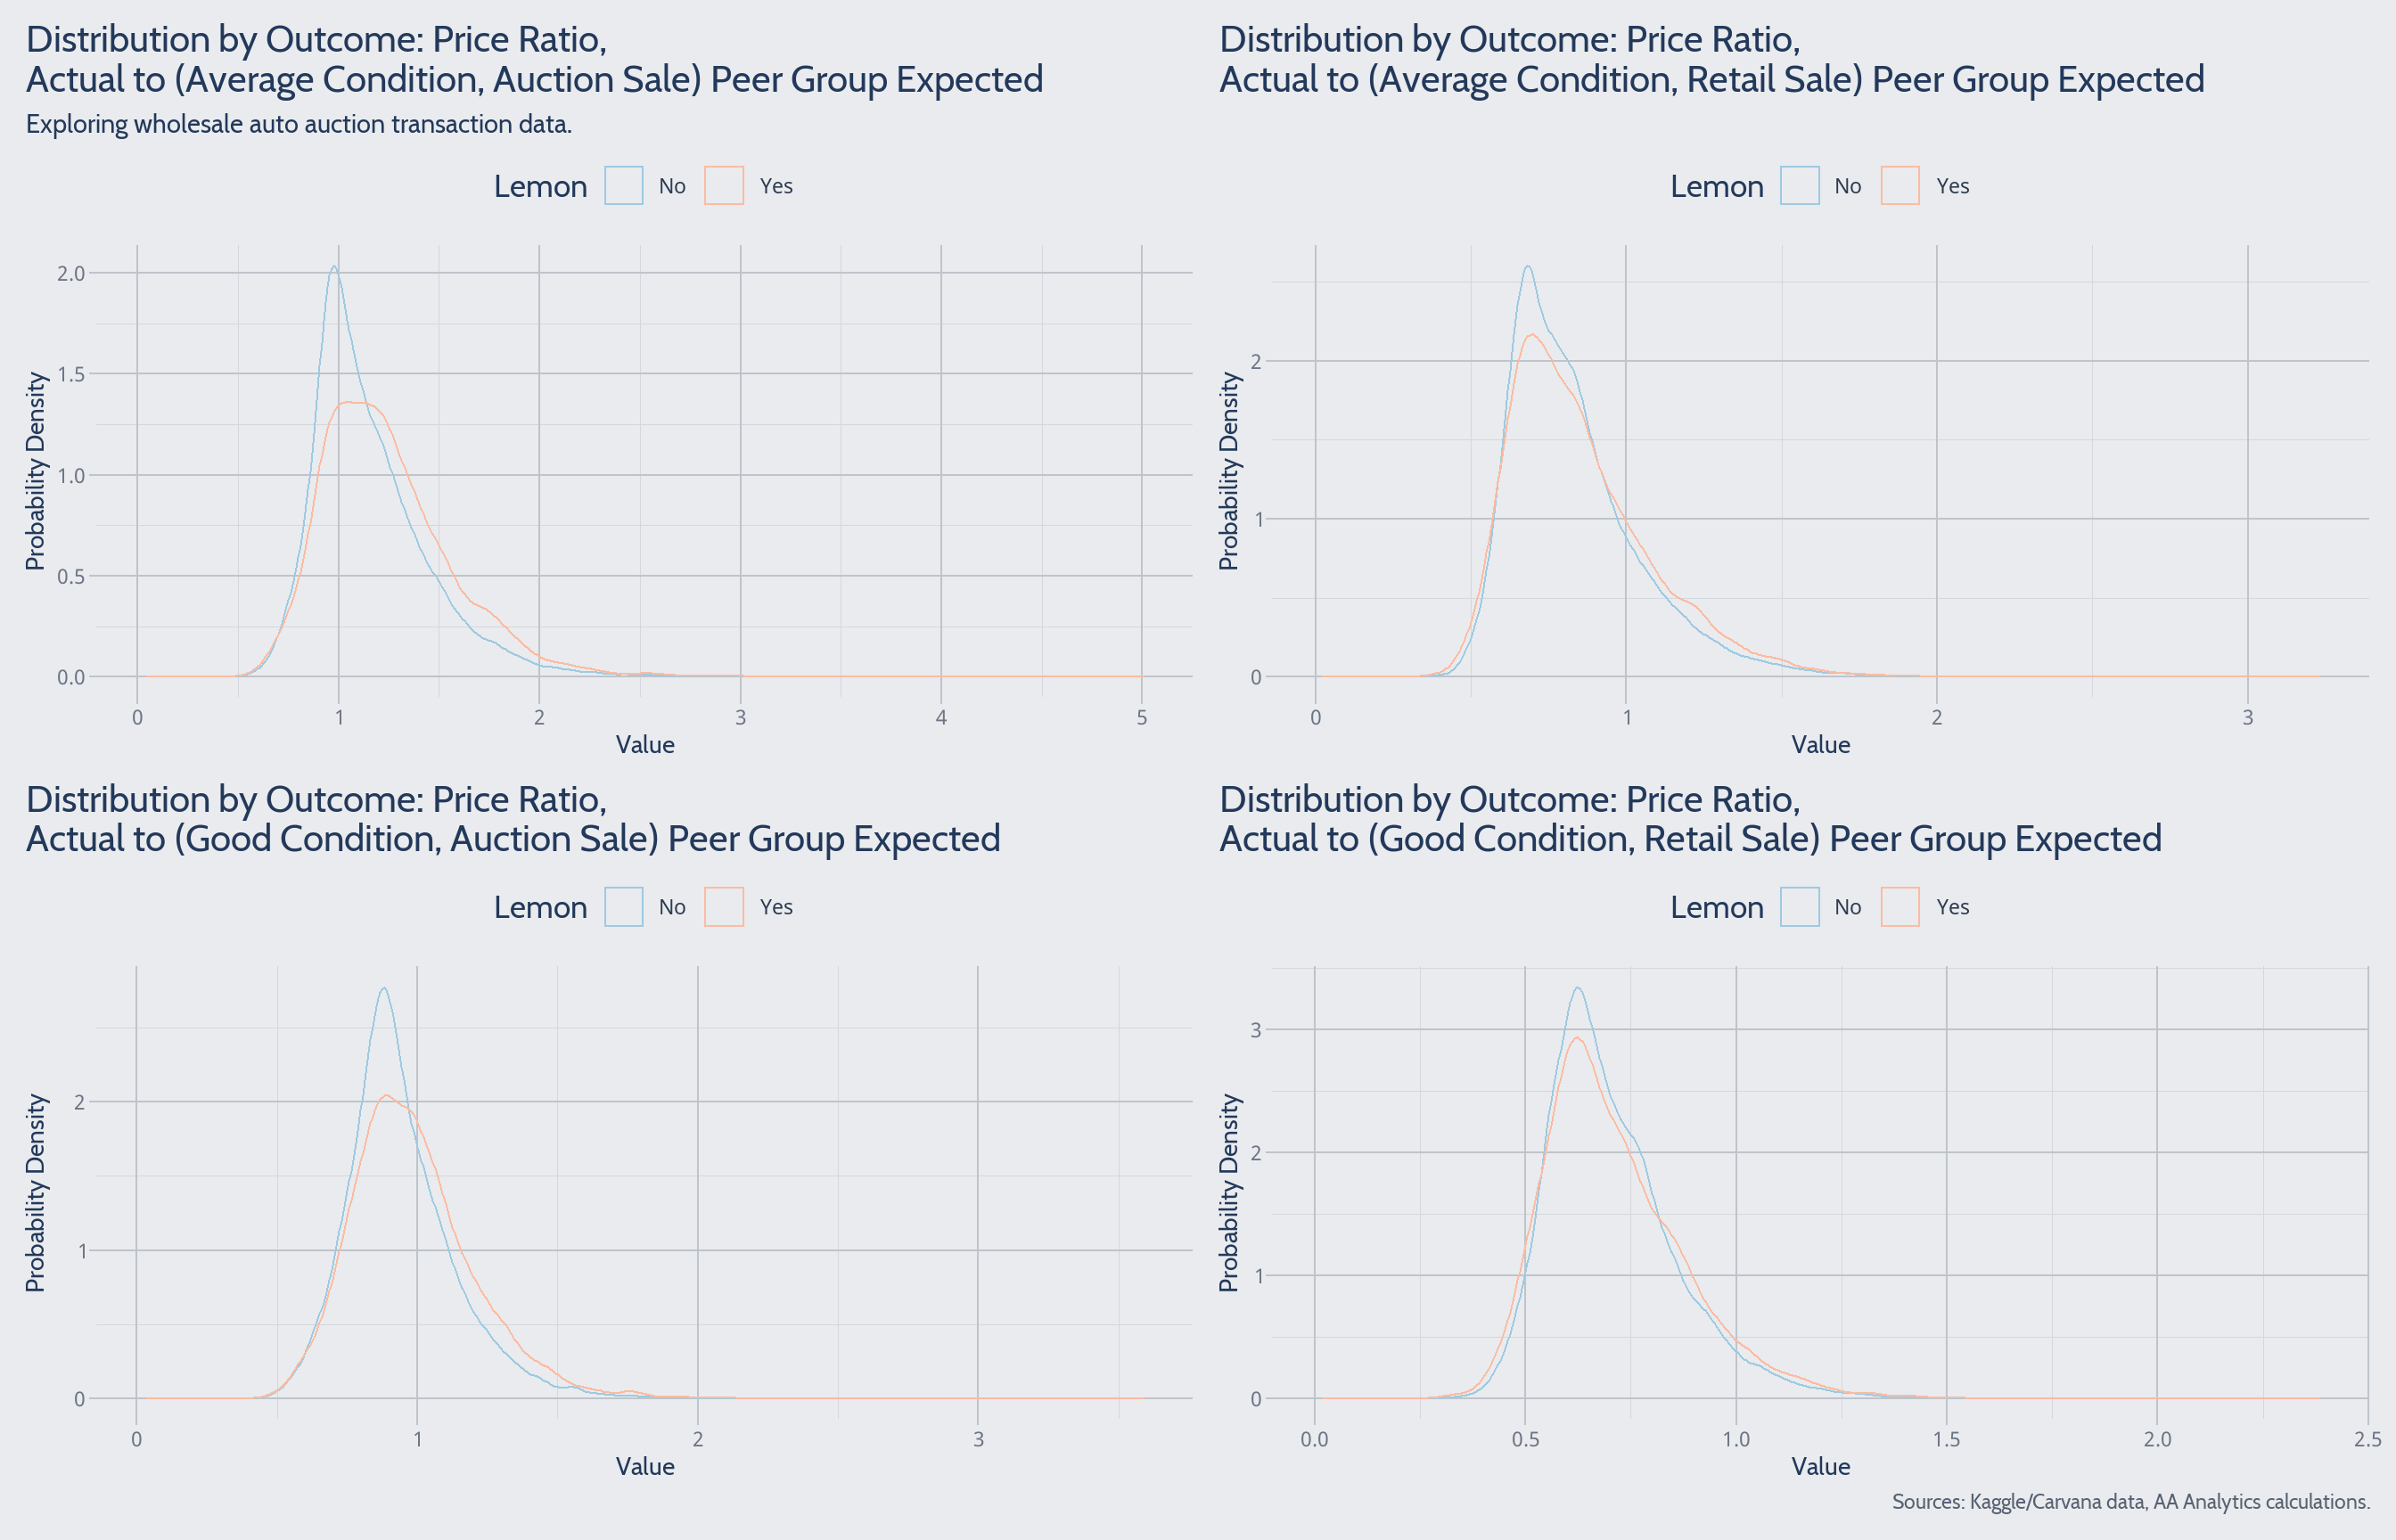
These charts raise more questions than they address. At first glance, it appears that high relative prices occur more frequently among lemons. For example, consider the price ratio for average condition/auction sale peer group (top left). There’s higher concentration within 1.25 to 2 among lemons, versus not-lemons. How could this be? Perhaps the visual differences in concentration are quantitatively insignificant. Or perhaps the peer group definitions have strong influence.
A data-driven theory arises from a study of the warranty-to-price ratio:
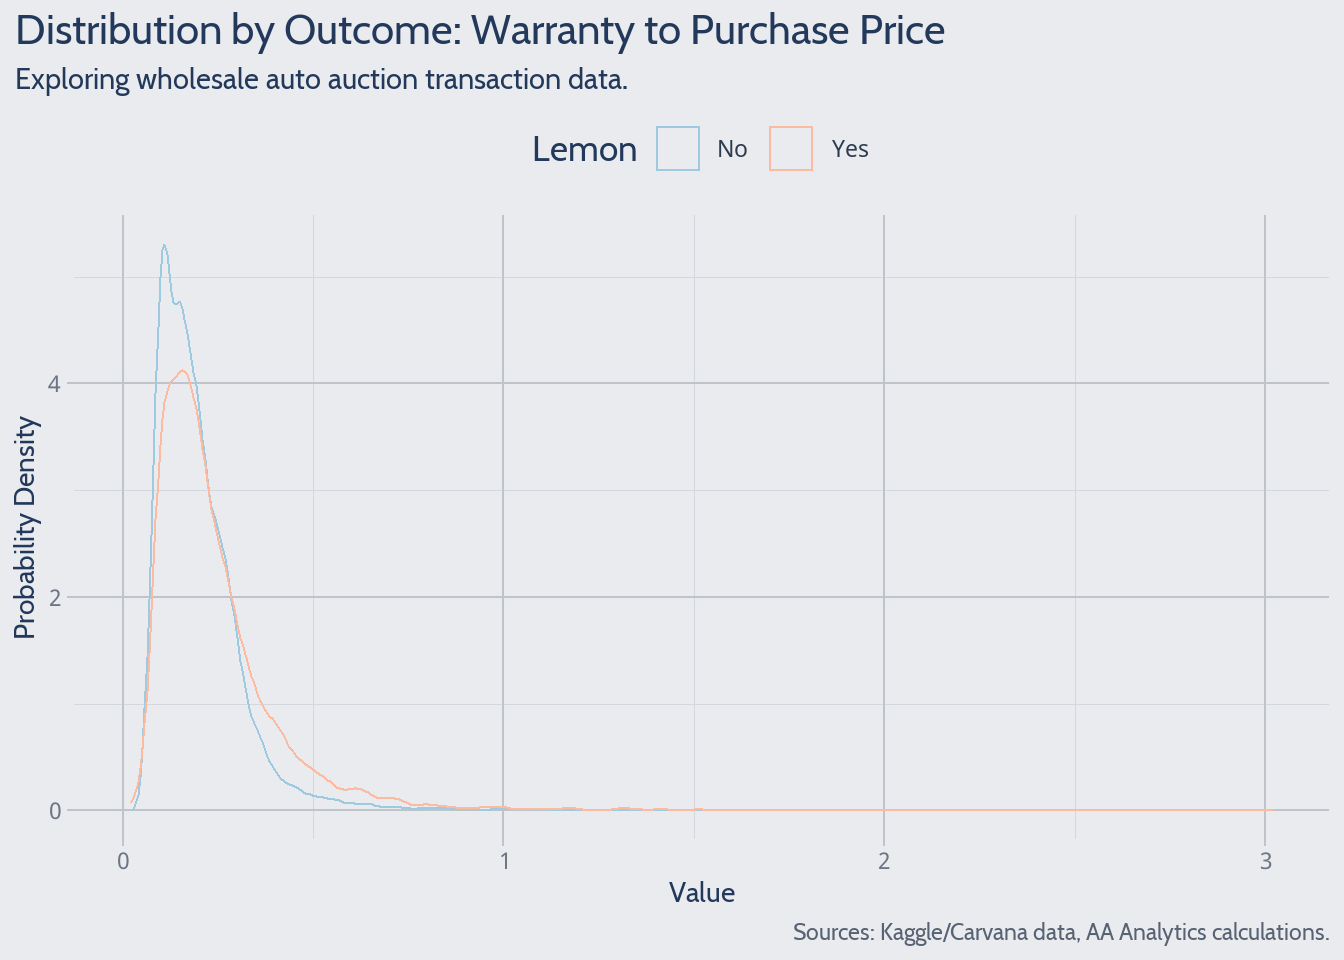
High warranty-to-price seems to occur more frequently among lemons. This makes good sense – as lemon risk rises, so too should relative warranty price. If the data’s recorded vehicle price includes warranty price, the former may appear elevated relative to peers.
Mileage
Vehicle mileage offers perhaps the most intuitive predictor of lemon probability.
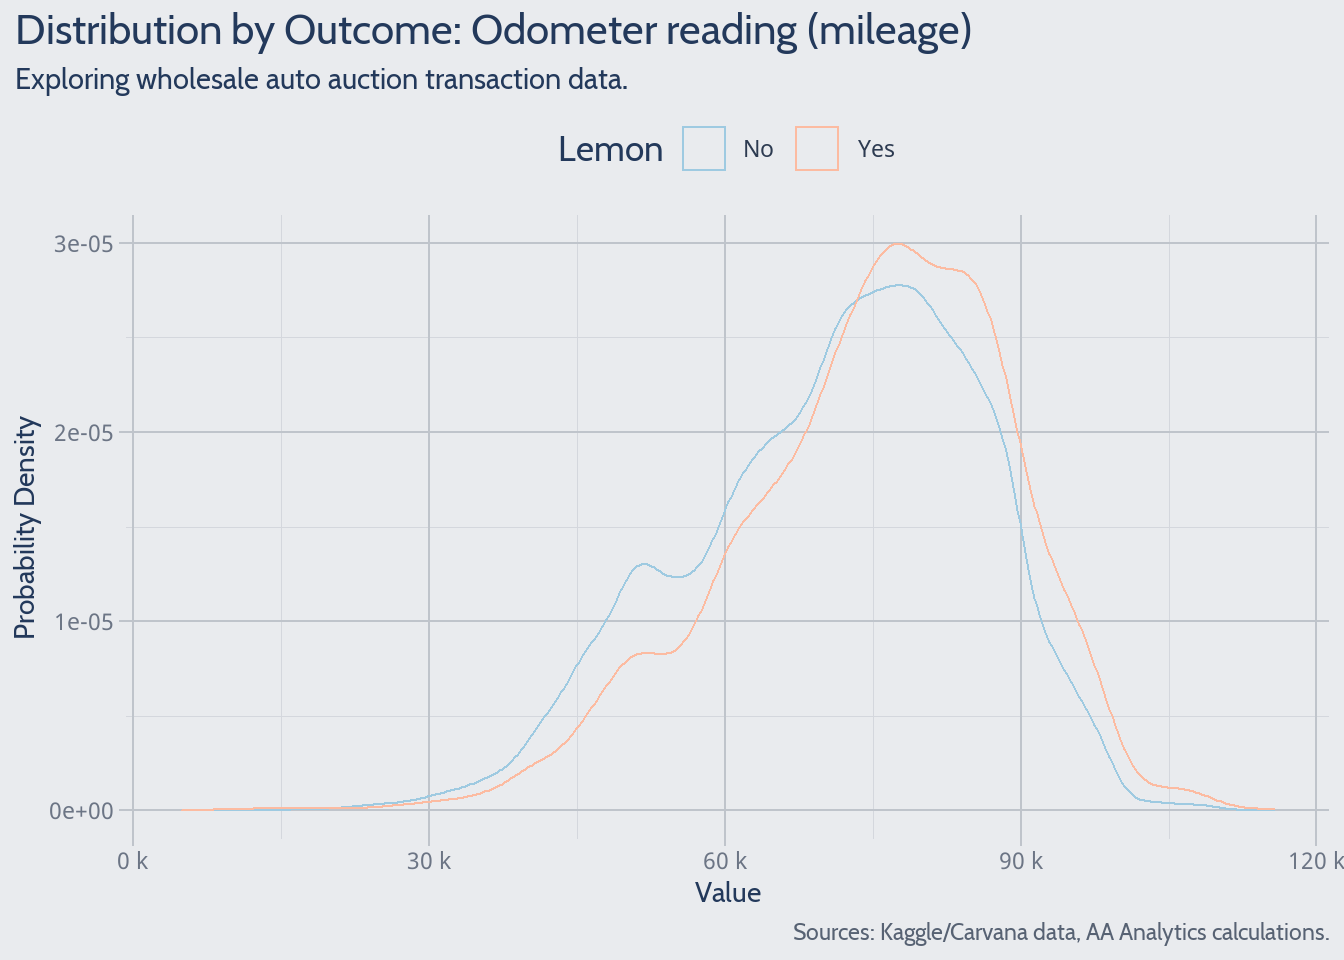
High mileage occurs more frequently among lemons. The interesting part will be quantifying how lemon risk varies with mileage.
We’ve Only Scratched the Surface!
I draw highlights from this first project step and map the road ahead.
Simple single-variable tabulations reveal the broad contents of sold-at-wholesale auto auction data. Some quirks become apparent – see wheel type, for instance. However, no critical data quality concerns arise.
Categorical predictors of lemon probability may take many possible values – see Make or State.
- How should a quantitative model handle rarely-observed predictor values? When low frequency counts render the primary data weakly informative, might strategic data down-weighting improve predictions?
Charts suggest which predictors have first-order impacts on lemon rate.
- How will a quantitative model rank variables’ importance?
- How do predictors jointly impact lemon rates? For example – consider three separate lemon rates, among: (a) 2005 manufacturer year, (b) Chevrolet, and (c) Equinox models. Should these pieces come together and correctly describe the lemon rate for 2005 Chevrolet Equinoxes? Perhaps not. When vehicle characteristics are considered separately, there may be a joint dynamic missed. There exist enormously many combinations of this sort. Automated quantitative models will drive this exploration efficiently.
References
Kaggle, Carvana. 2012. “Don’t Get Kicked!” URL: www.kaggle.com/c/DontGetKicked/overview/description.
Sources: Featured Carvana dataset, author’s calculations. Years examined are 2009 and ’10.↩︎
A “row” may also be called a “record” or an “observation”.↩︎
I omit some predictors contained in the full data because they convey redundant information.↩︎
In the lingo, exploratory data analysis (EDA).↩︎
I reserve technical predictive algorithms for later posts.↩︎
In the interest of brevity, I present the recorded values after accounting for missing data and other quirks.↩︎